Bar chart |
  
|
Bar chart |
|
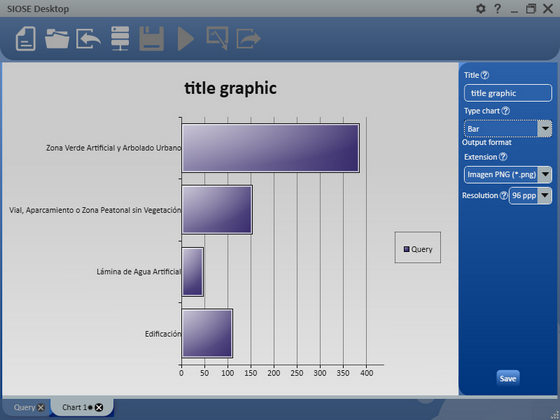
It shows the values as horizontal columns. Its length is correlated to the value showed.
|
Figure 82. Window bar chart |
At your right, it shows the query name. At horizontal axis appear the total area (in hectares), and at the vertical axis are the coverage types of the queries outcomes.