Graphs |
  
|
Graphs |
|
|
Figure 78. Create graphs key |
It function consist in sum all the cover types, it makes different types of graphs (bars, column or pie); and finally it save the image with different formats: jpeg, png, bmp or tiff).
|
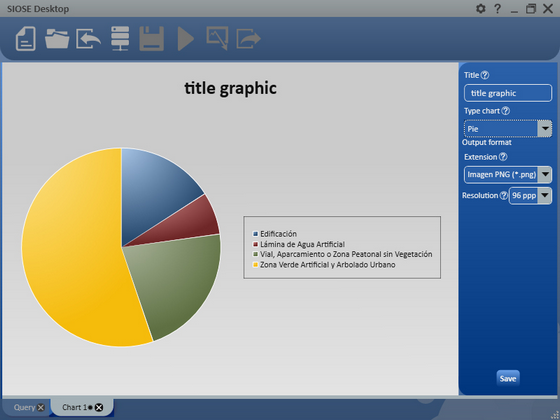
Figure 79. Graph example |
After the selection of the type of graph, it creates automatically the graph with a set of randomized colors. If you want to change the colors, just select several times the ramp color.
Select Title section if you want to write a new title for the graph.
Select graph type section to choose the kind of graph you want:
•Pie chart
•Bar chart
•Column chart
In Output format, you choose the output format and its resolution, the output format could be:
•Bits map (*.bmp)
•JPEG image (*.jpg)
•PNG image (*.png)
•TIFF (*. Tiff)
The available resolutions are the following:
•72 ppp
•96 ppp (by default, sufficient quality to visualized in the screen)
•150 ppp
•300 ppp (to print)
Finally, save key is used to indicate where you saved the selected image and its format.
|
Figure 80. Example of exported image |