Pie chart |
  
|
Pie chart |
|
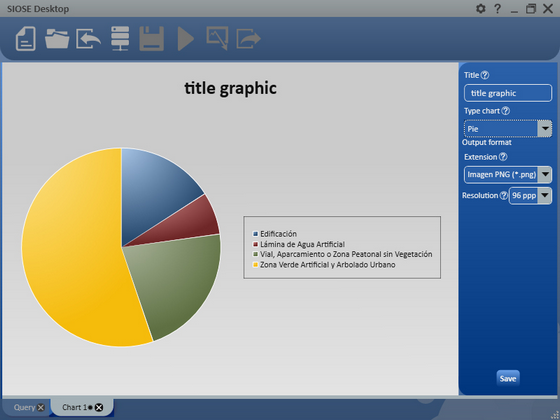
Pie chart shows the outcomes as a circle divided in sectors, where each sector is a part of the overall query.
It shows the cover position in relative terms respect to the total sum of cover surface selected.
|
Figure 81. Window Pie chart |