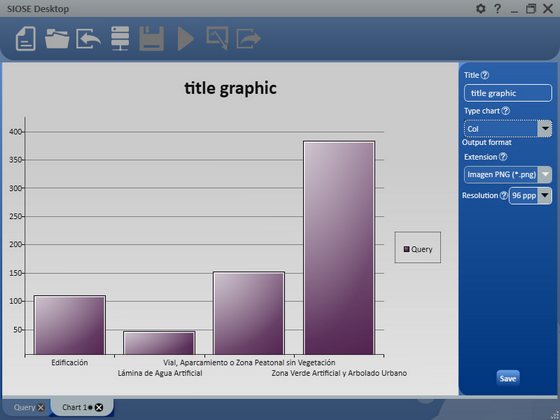
Columns chart |
  
|
Columns chart |
|
It is the same than bar chart, with the exception that the bars are vertical.
|
Figure 83. Window column chart |
At right it is the query name. The horizontal axis contains the covers included into the outcome query, and the vertical axis contains the total area (in hectares).