Seismic noise
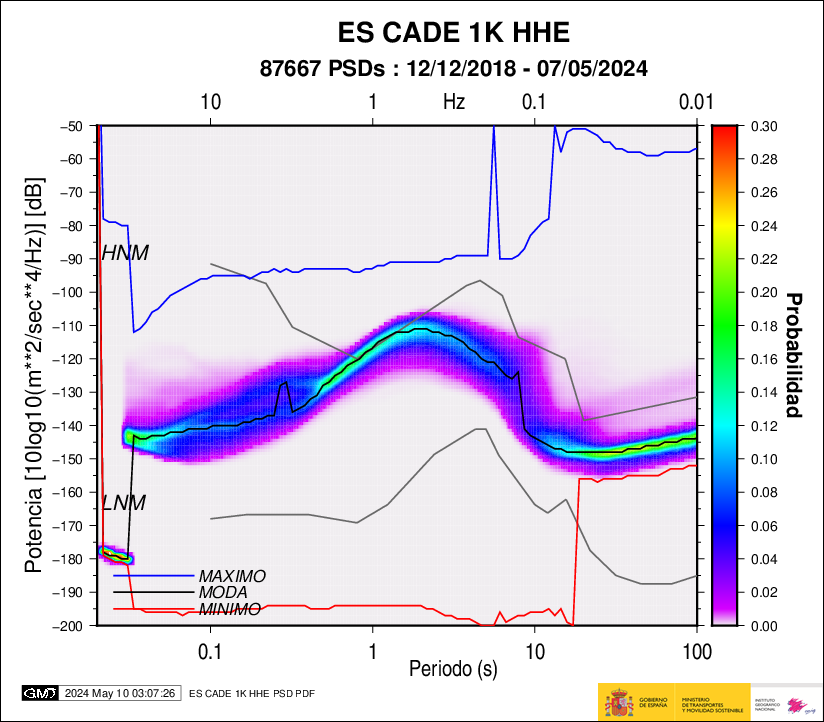
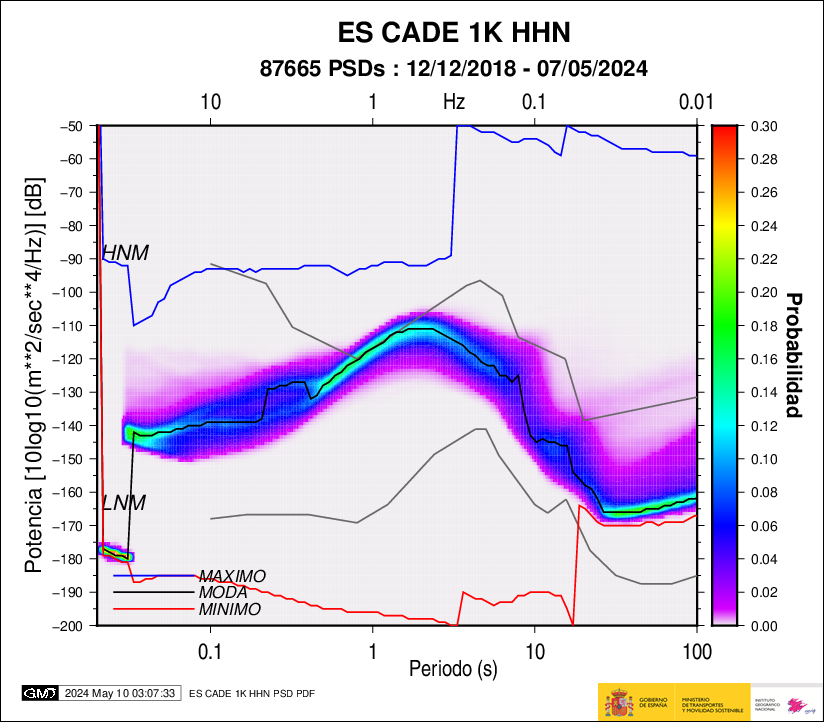
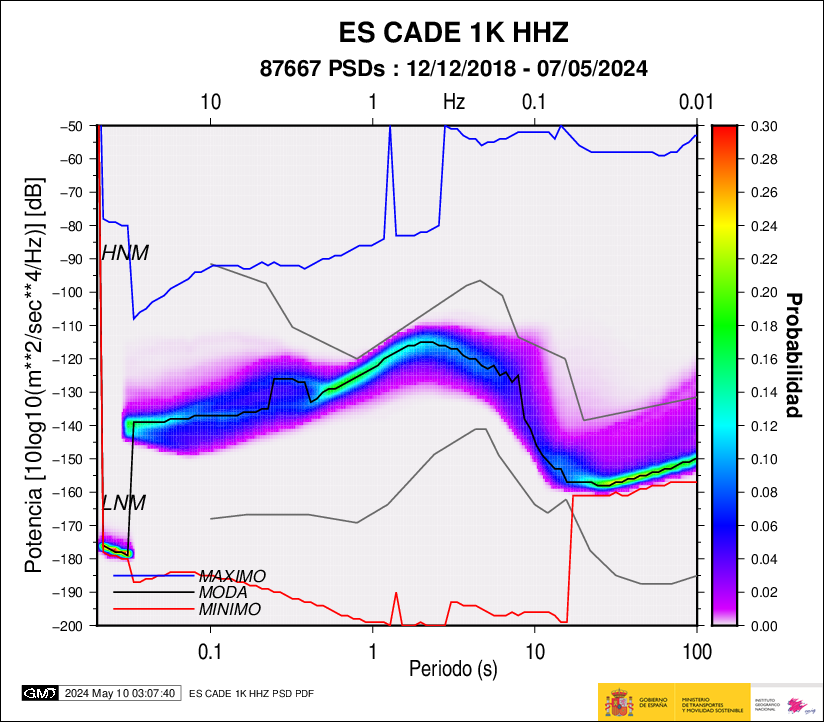
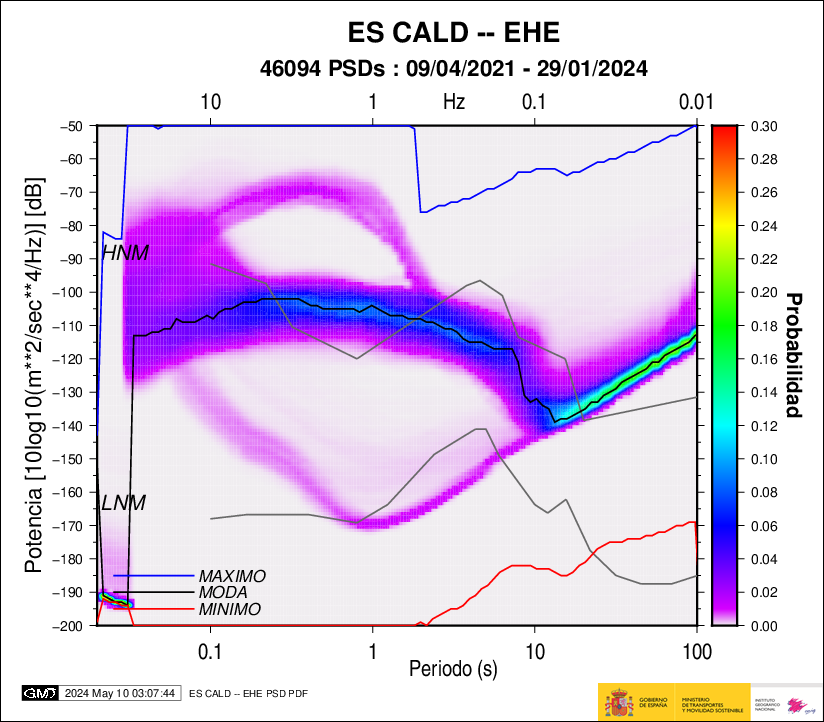
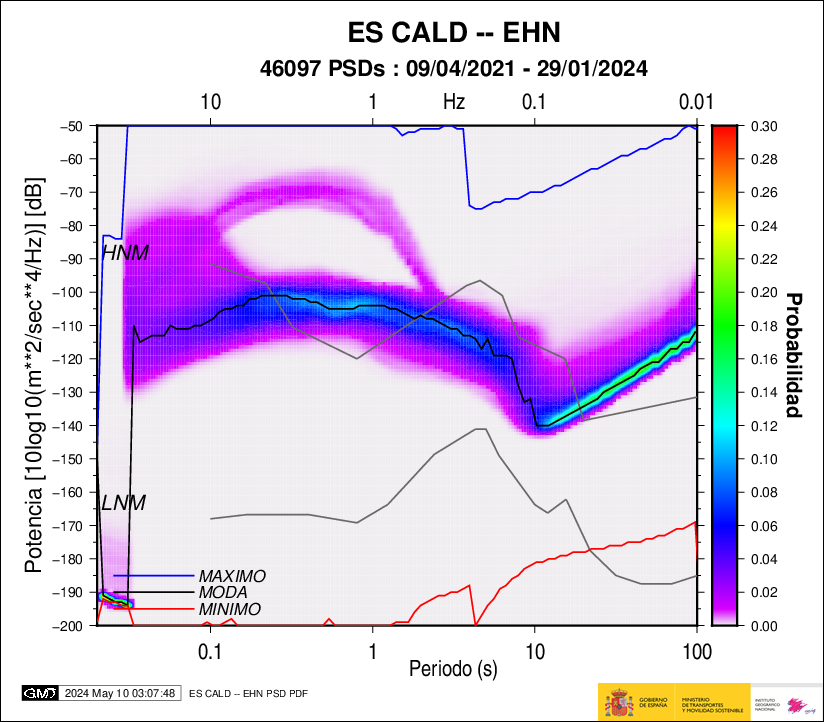
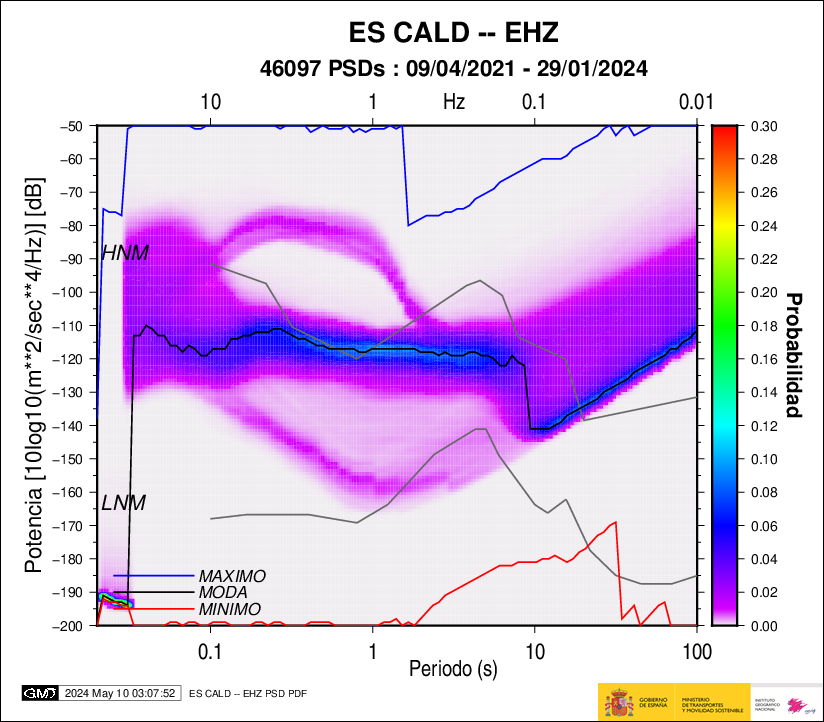
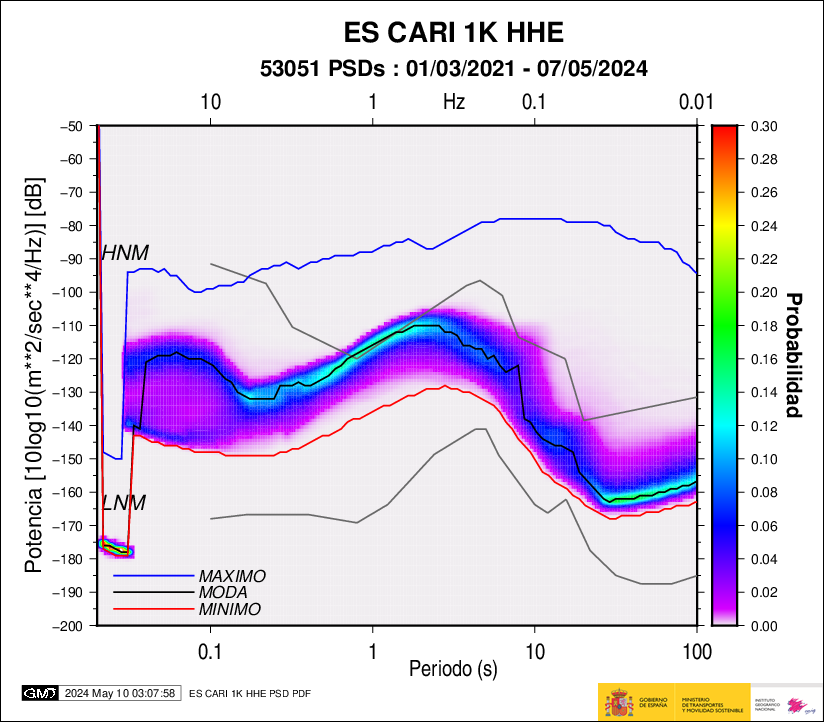
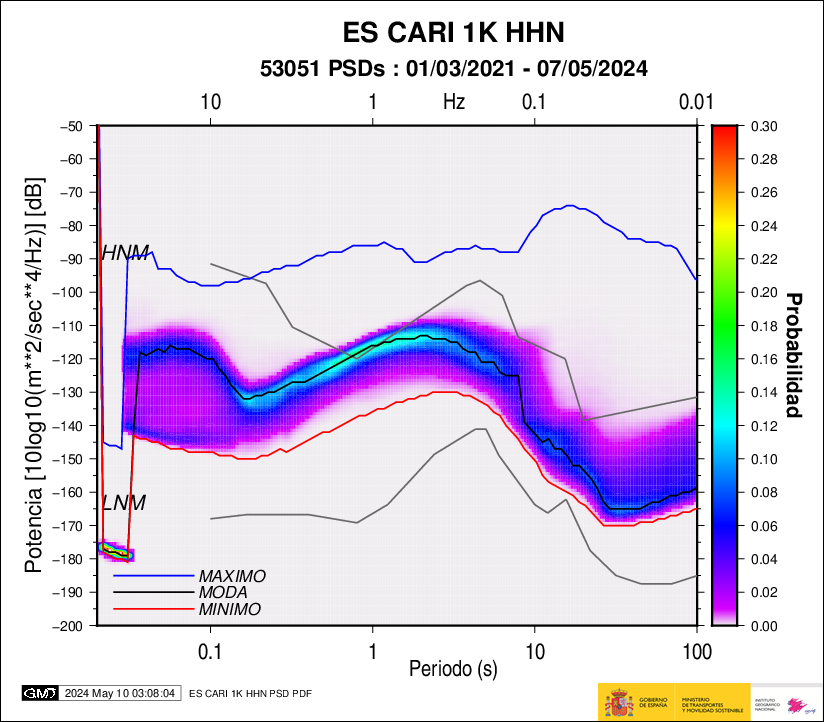
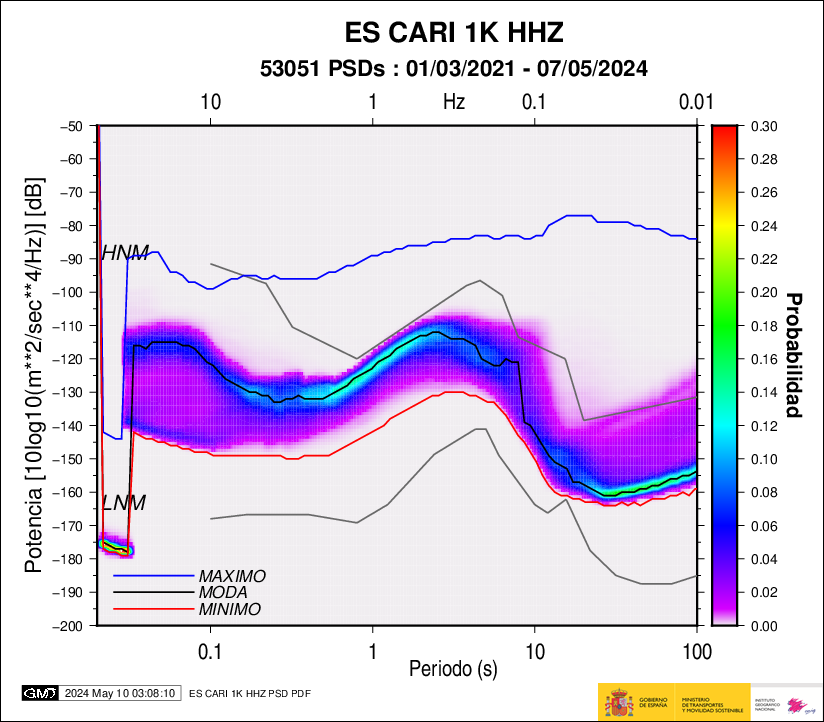
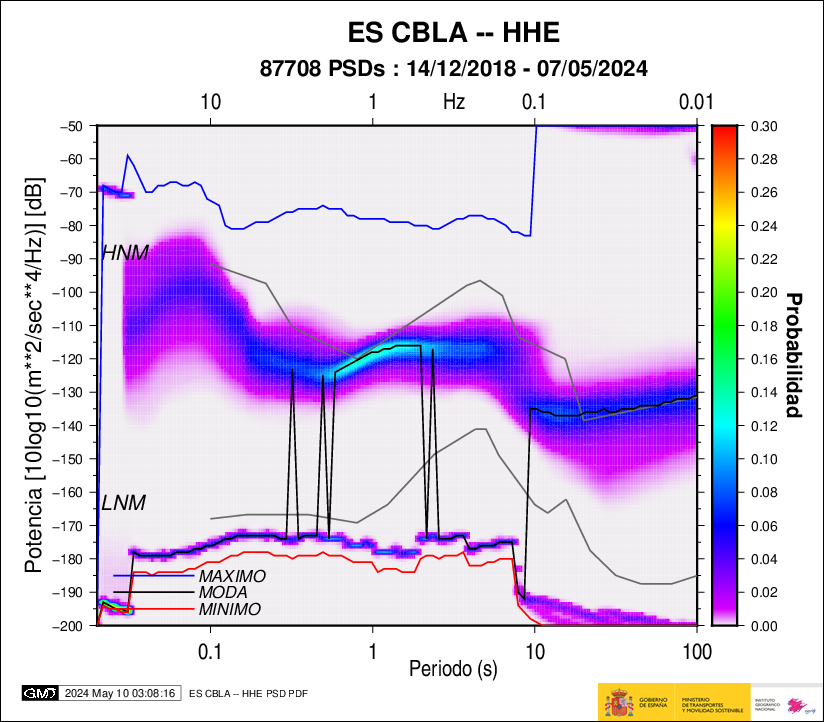
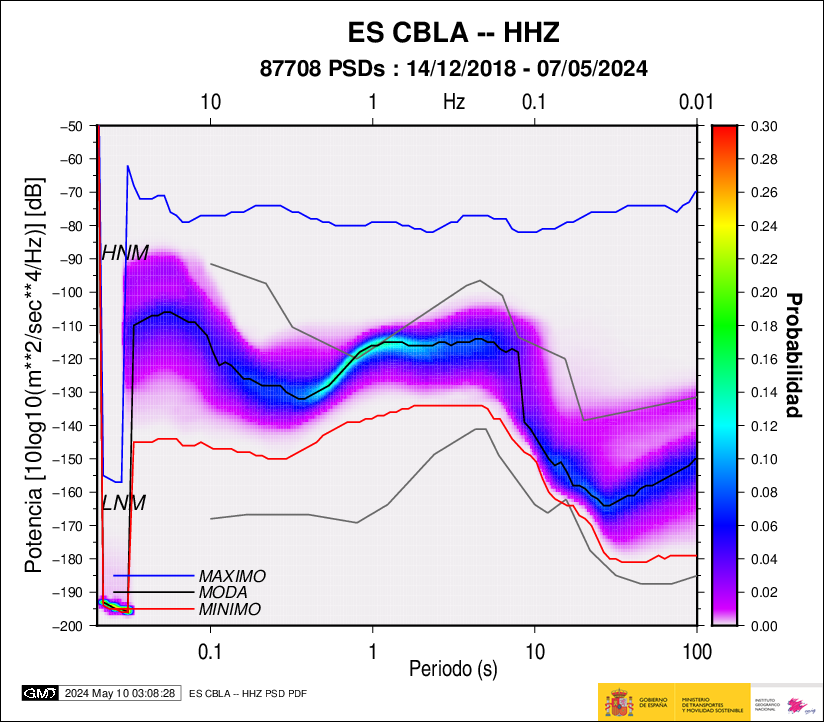
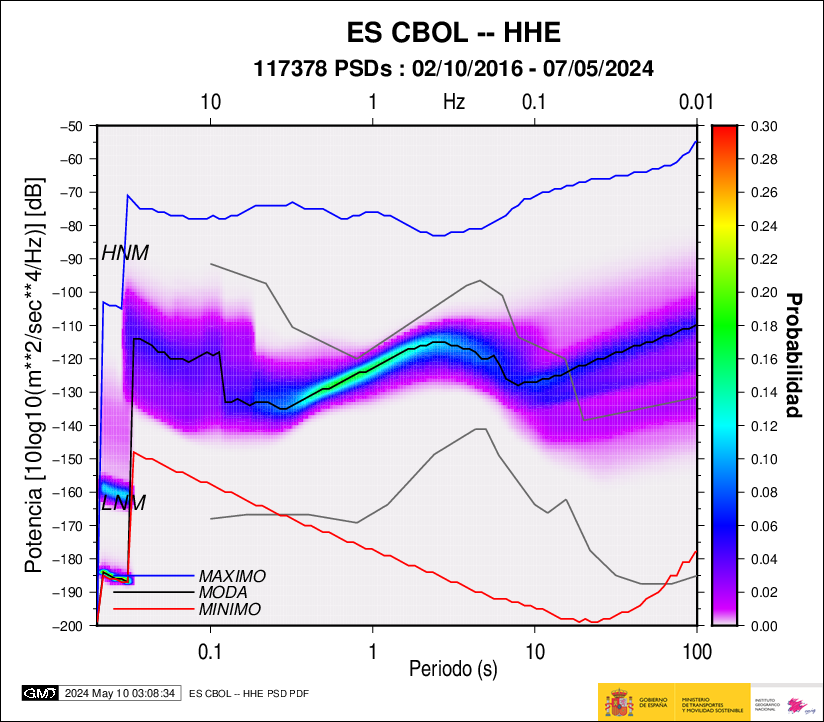
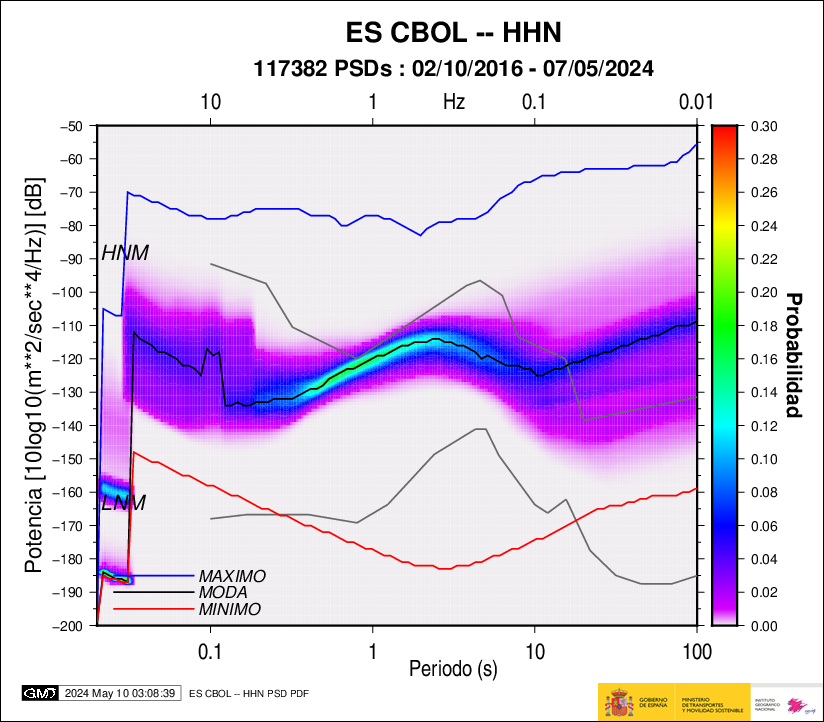
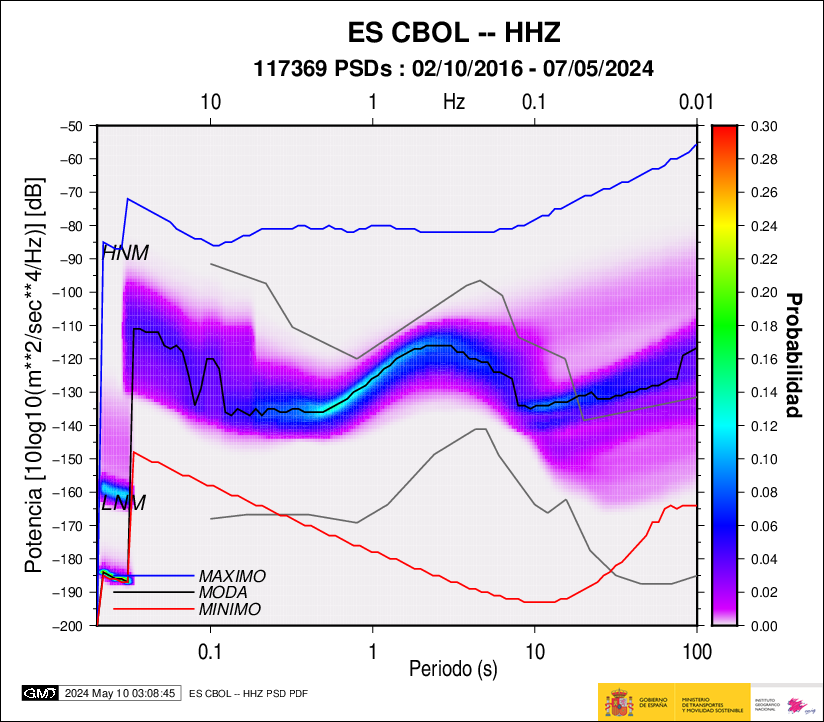
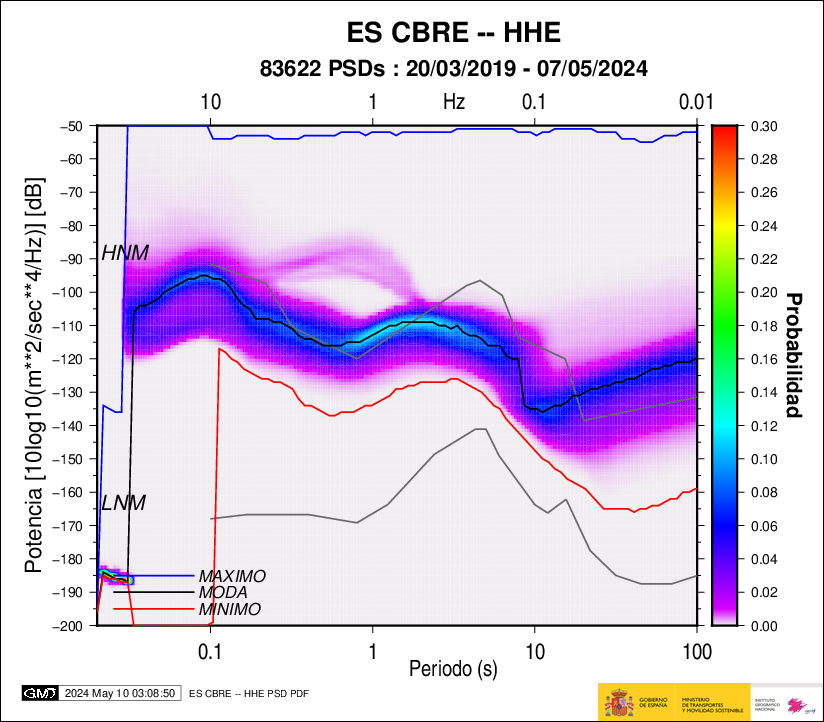
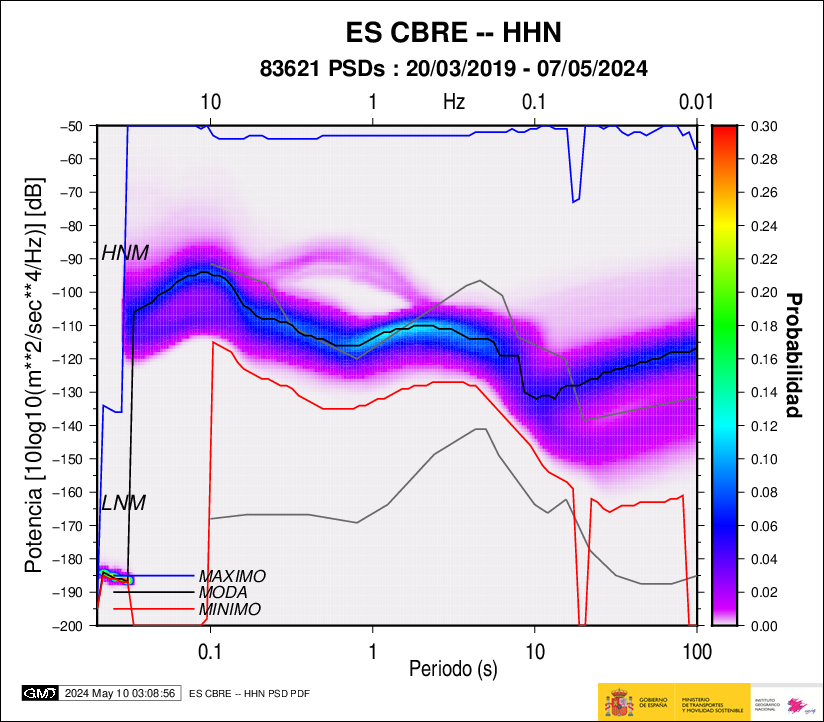
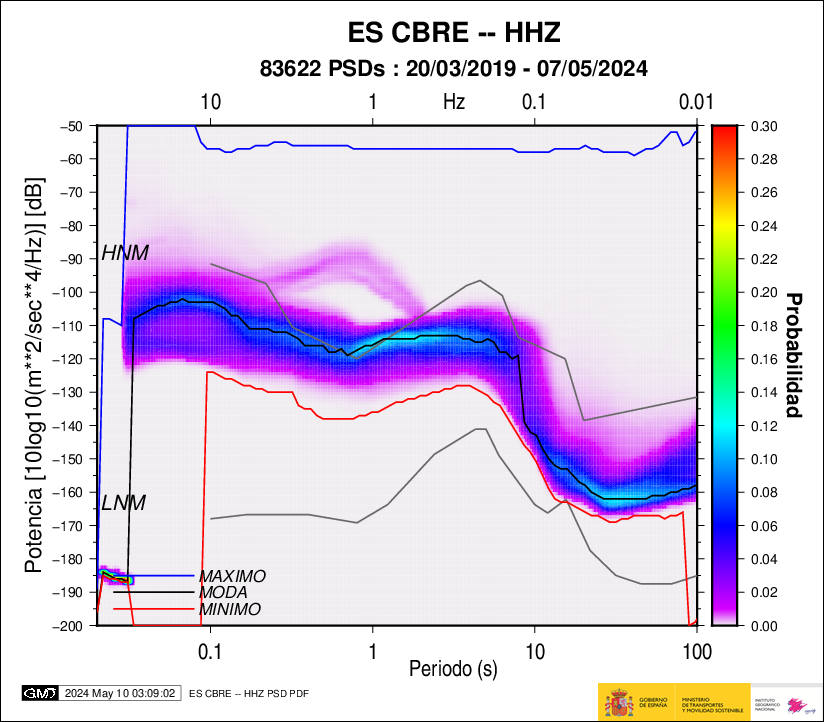
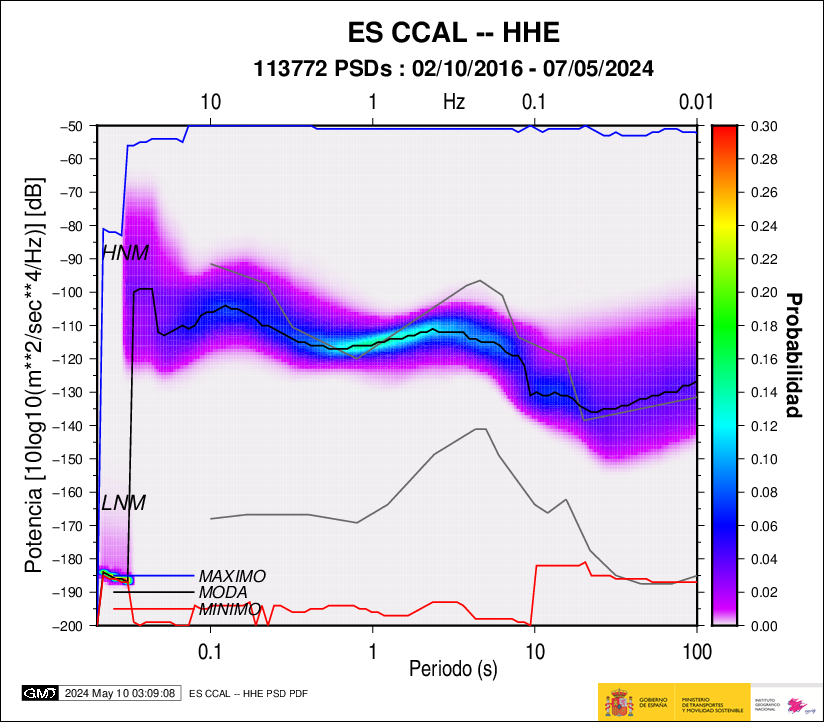
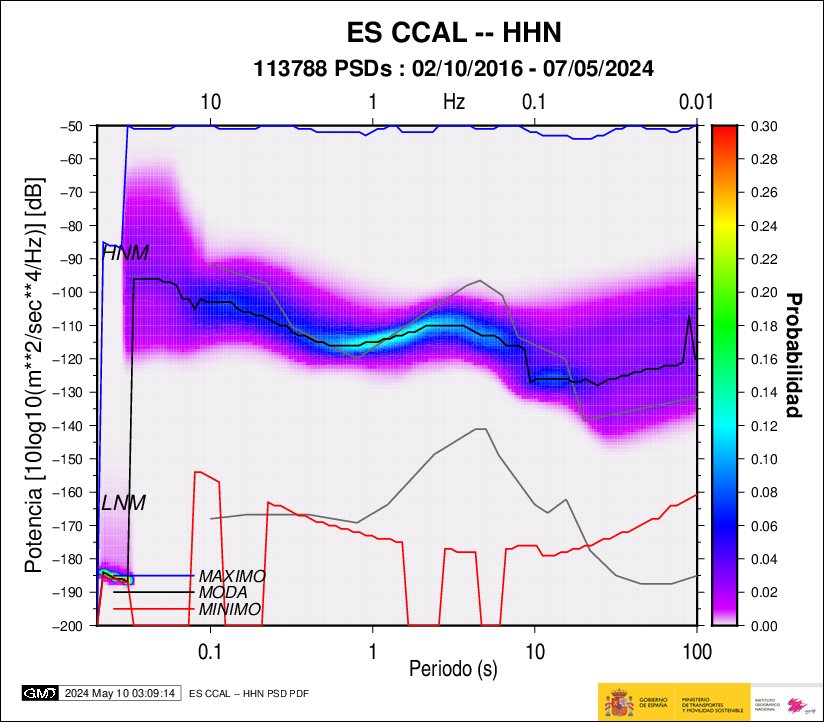
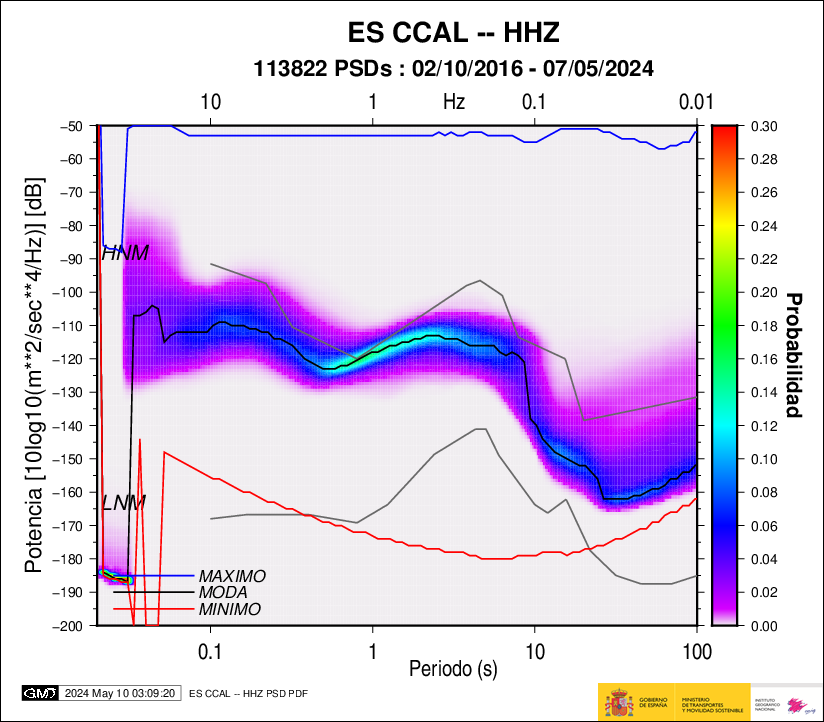
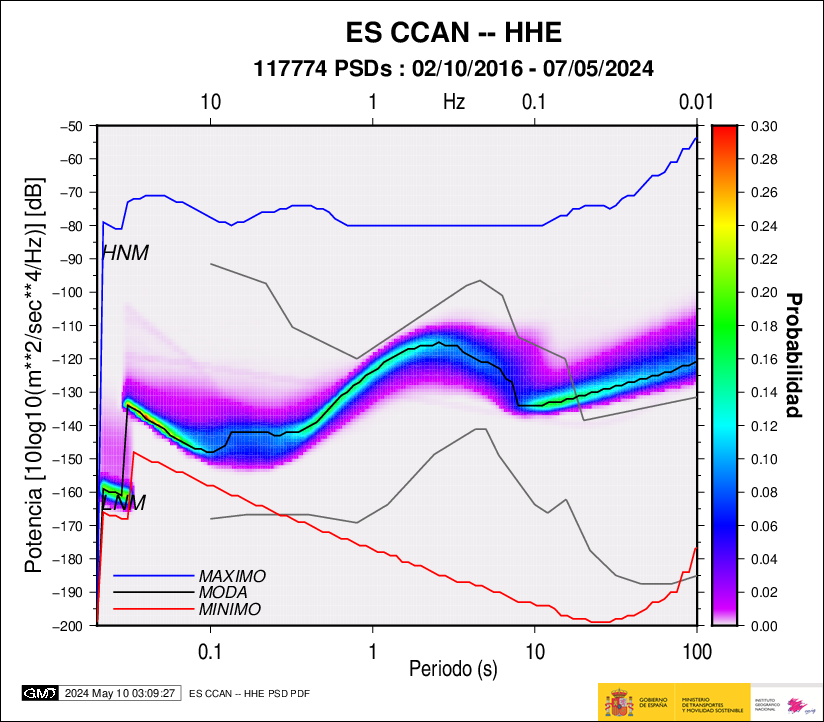
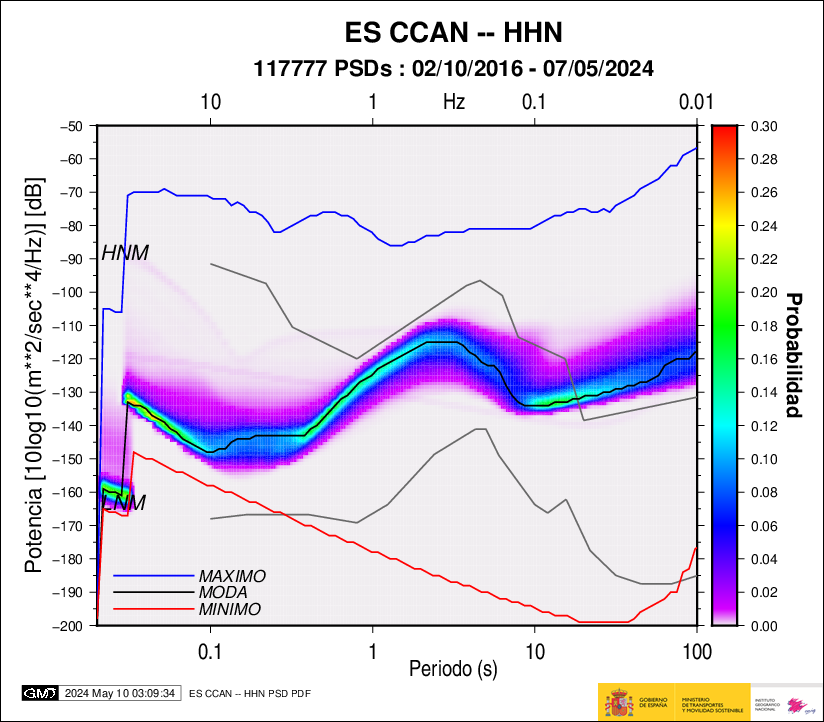
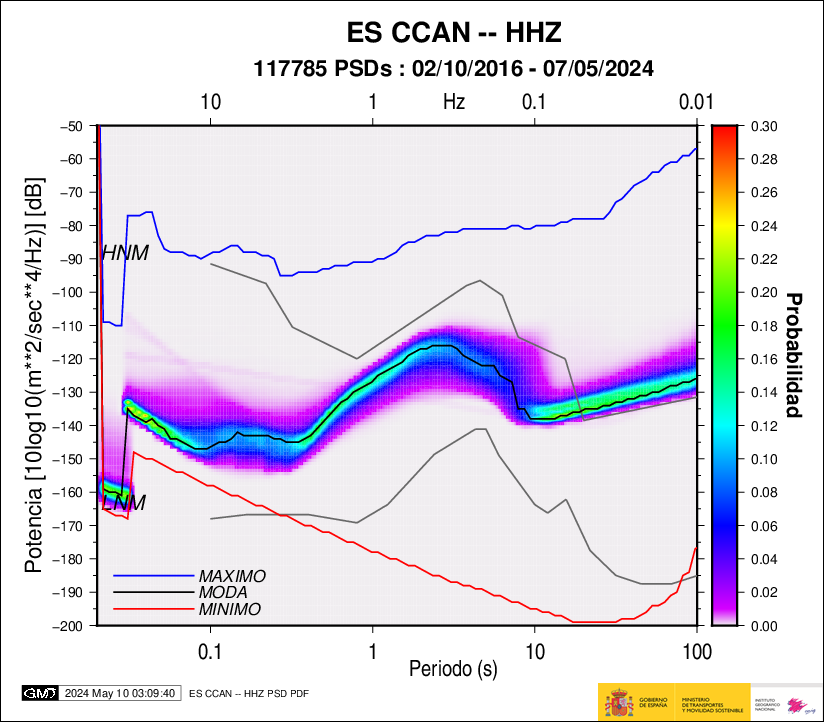
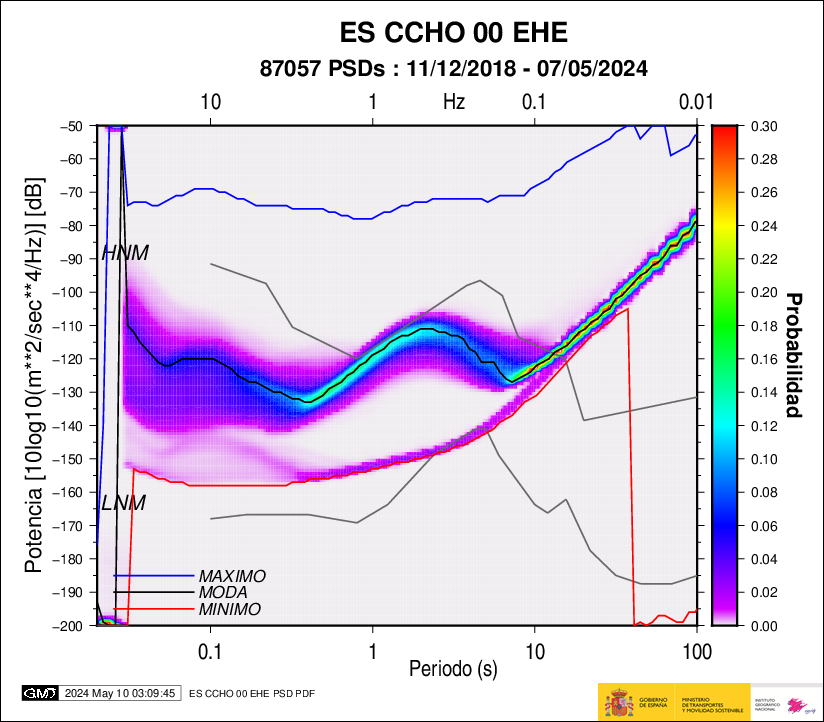
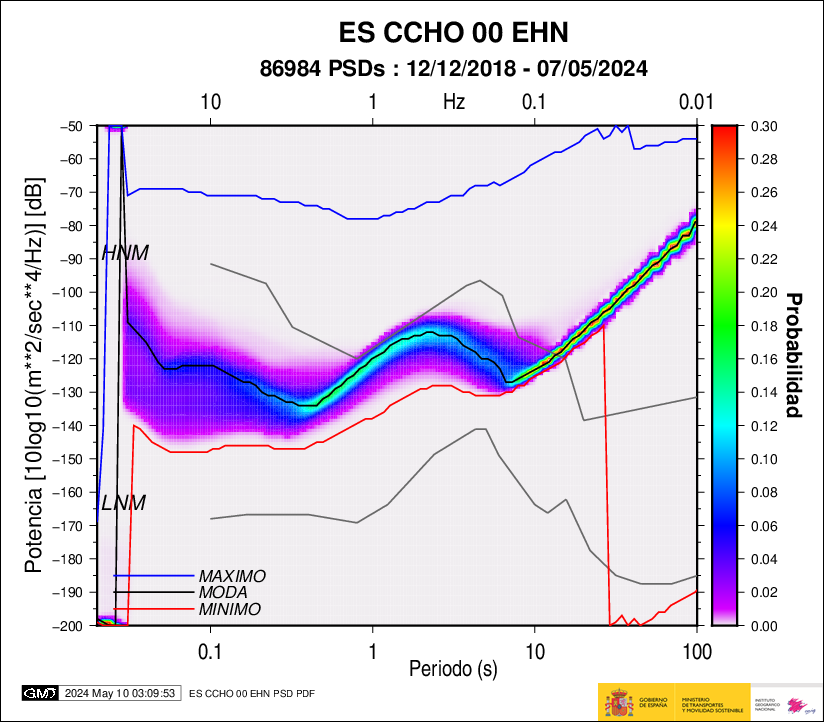
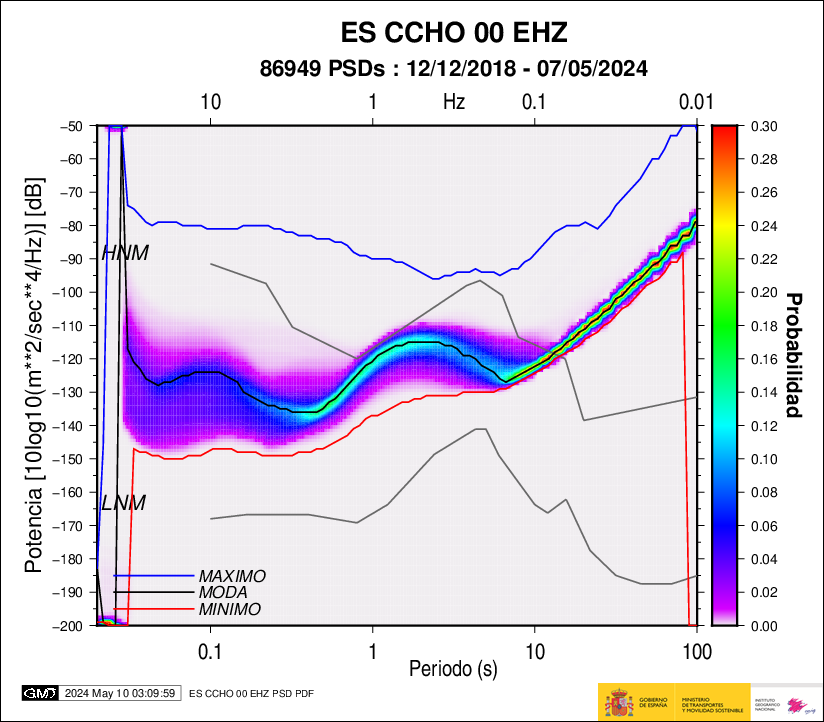
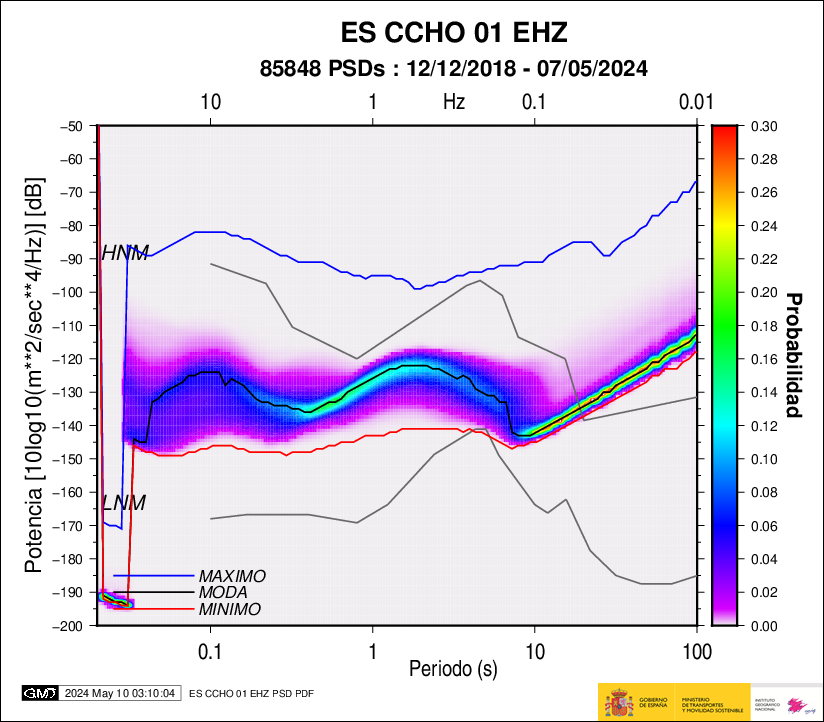
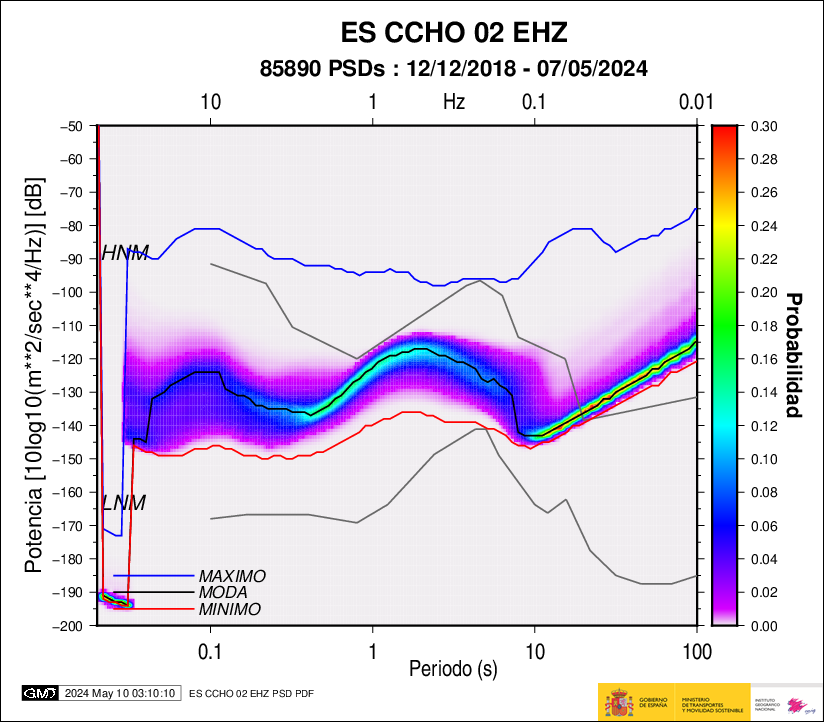
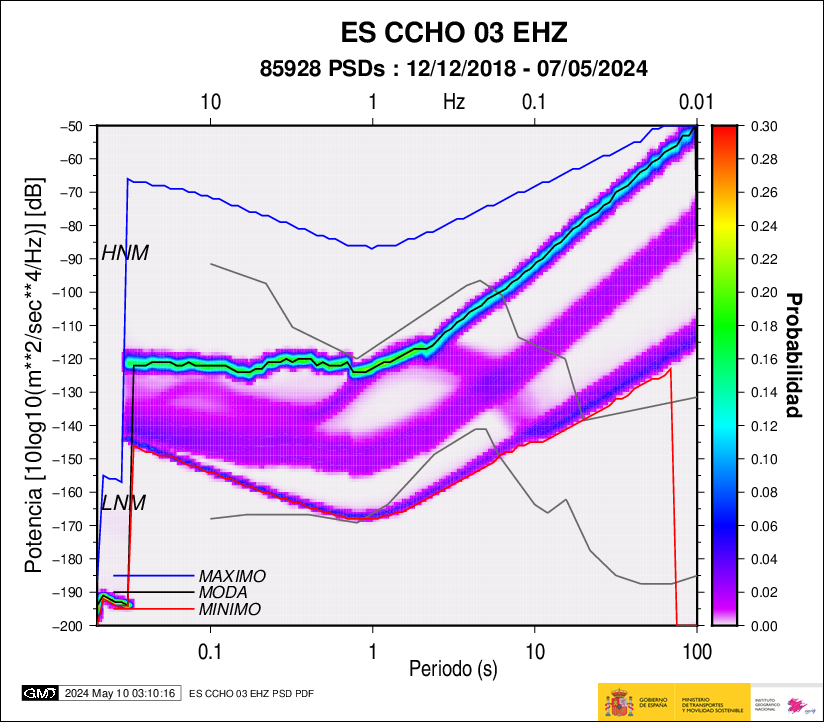
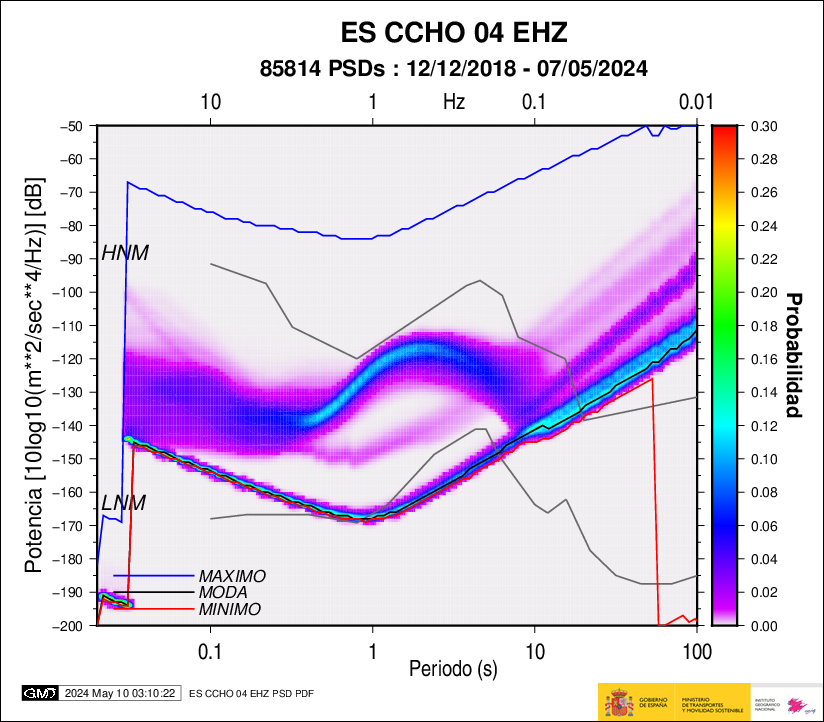
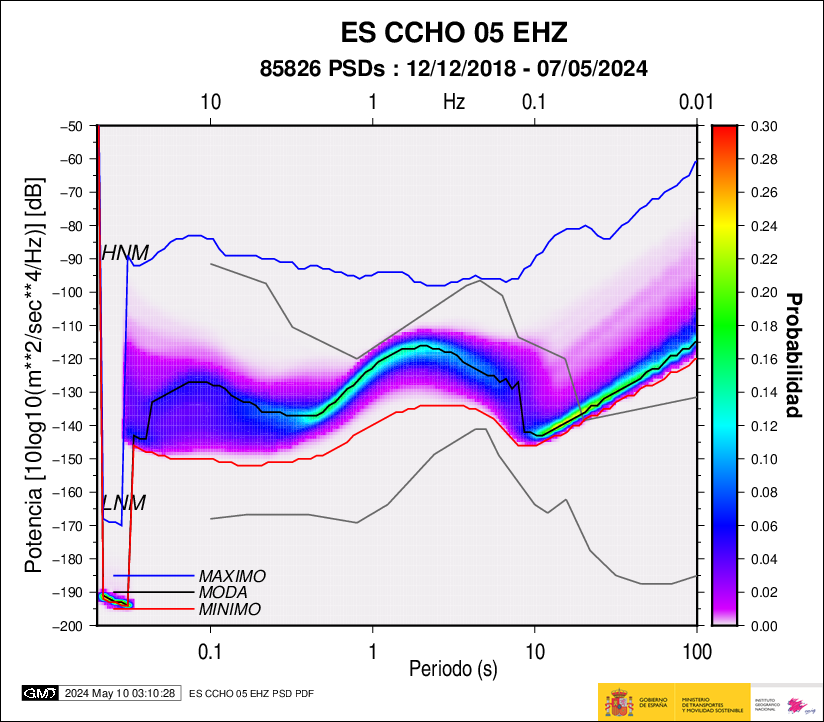
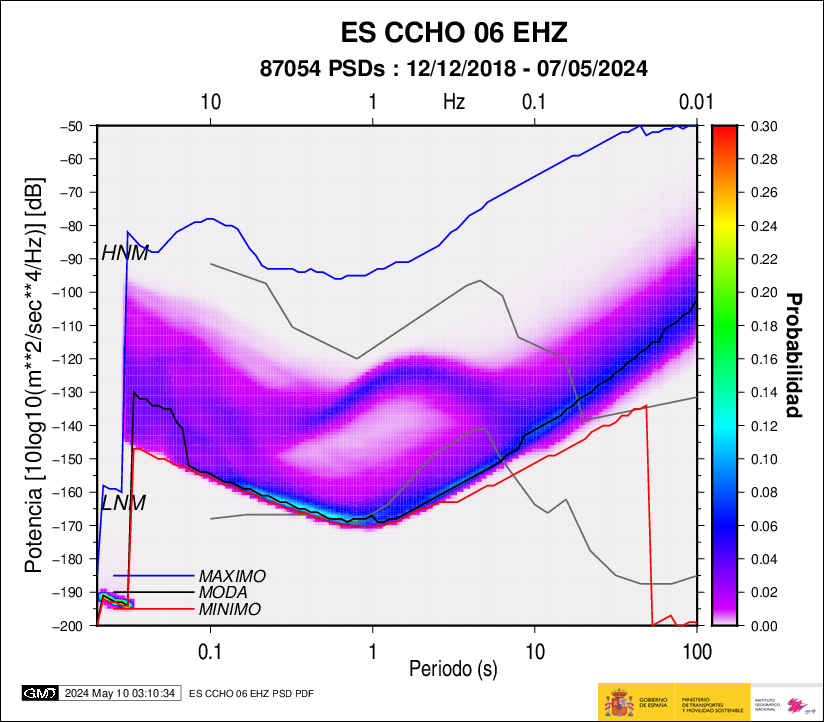
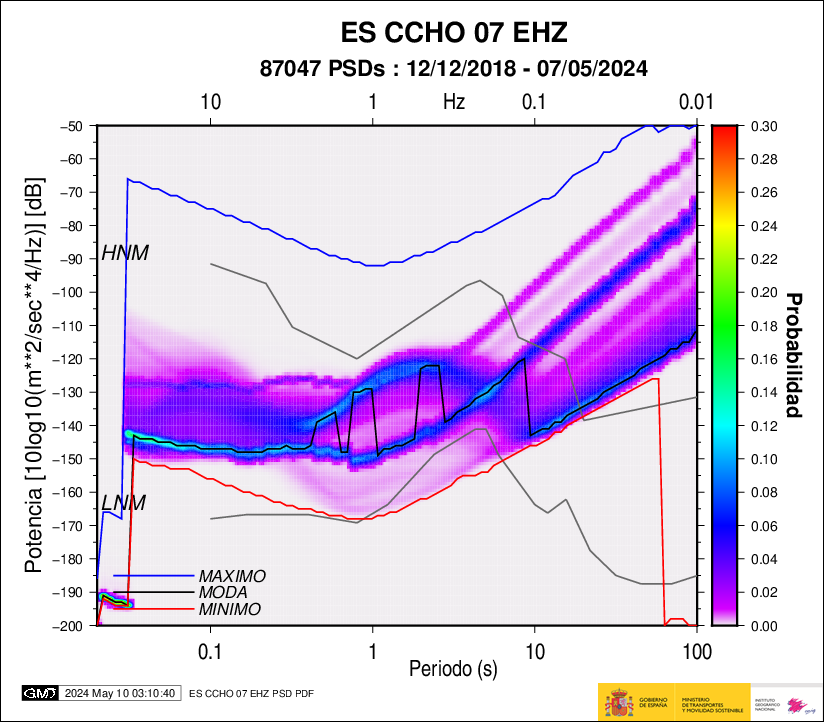
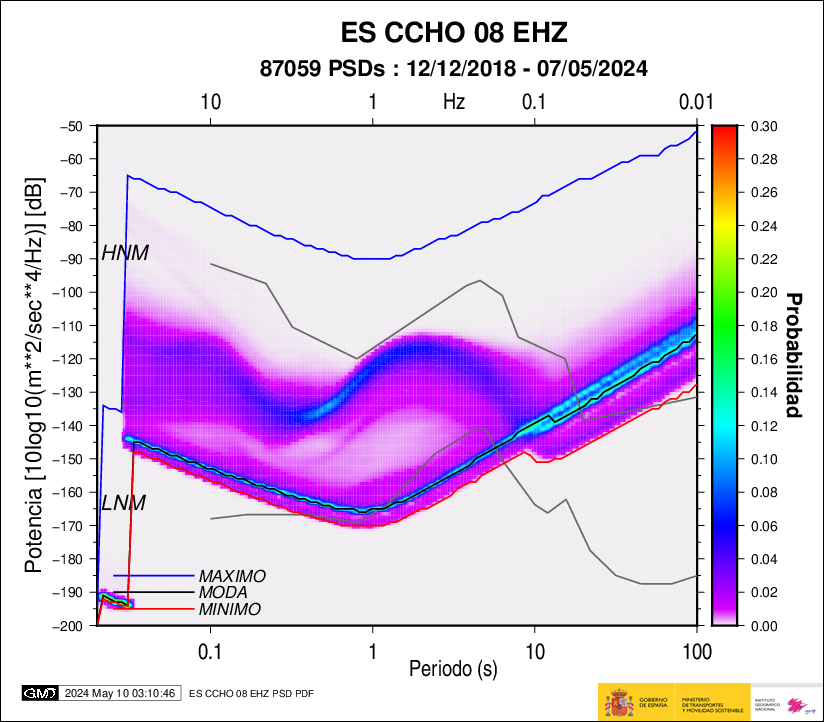
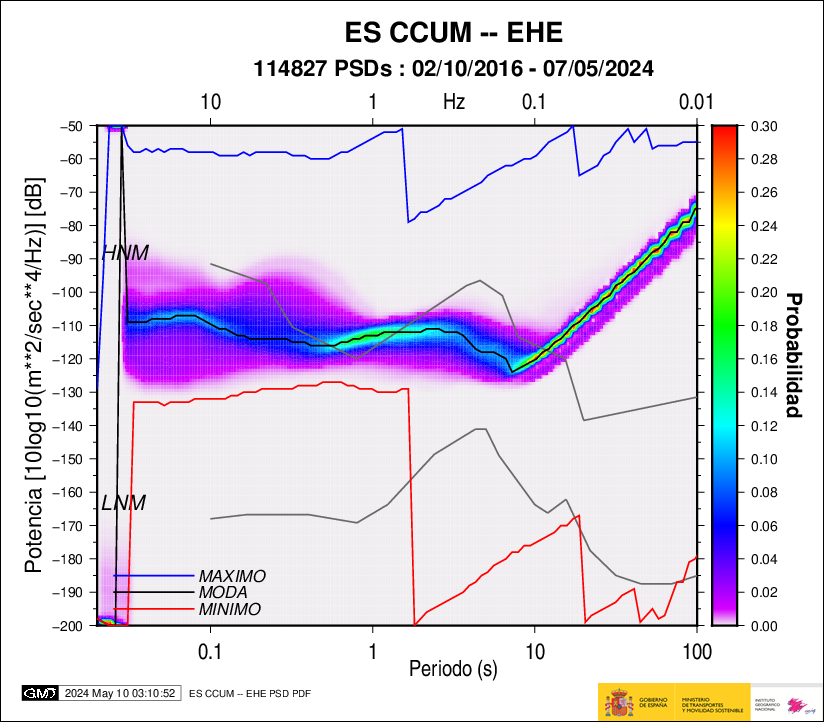
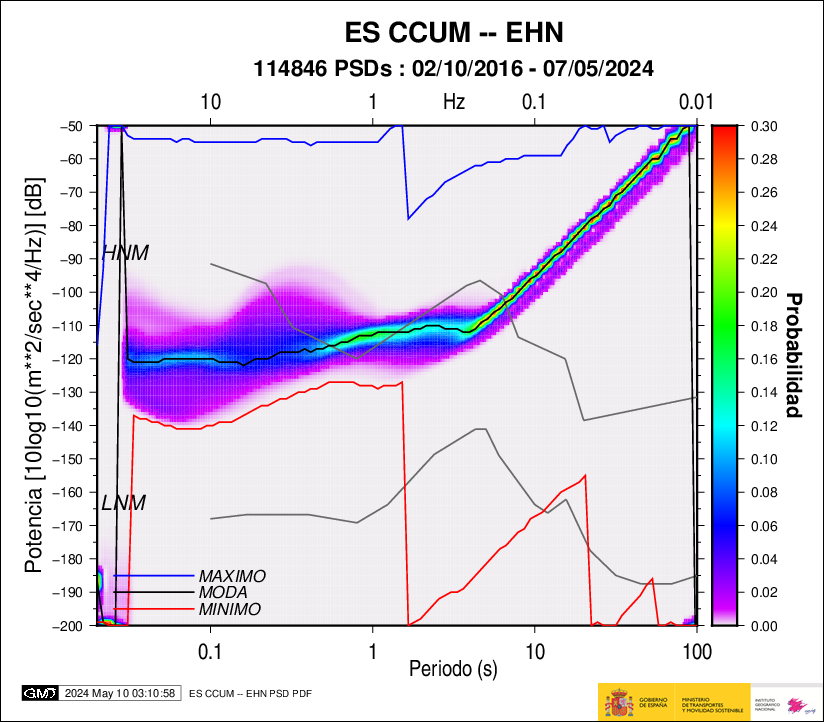
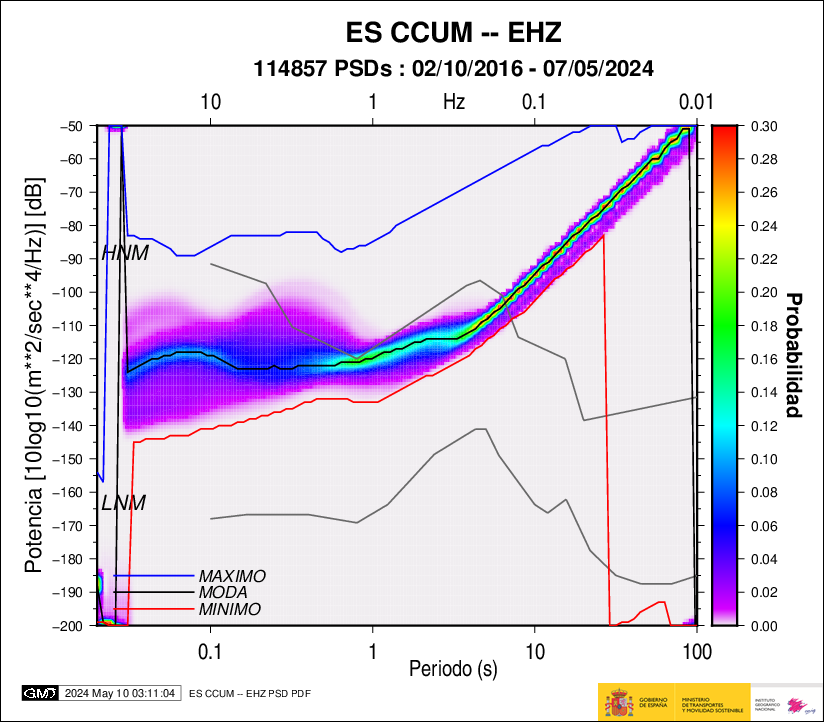
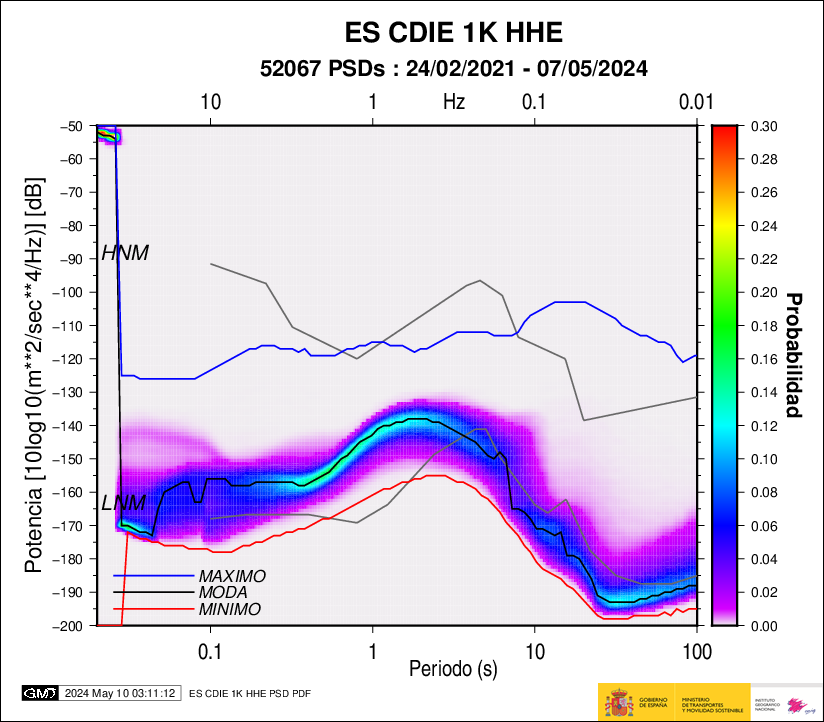
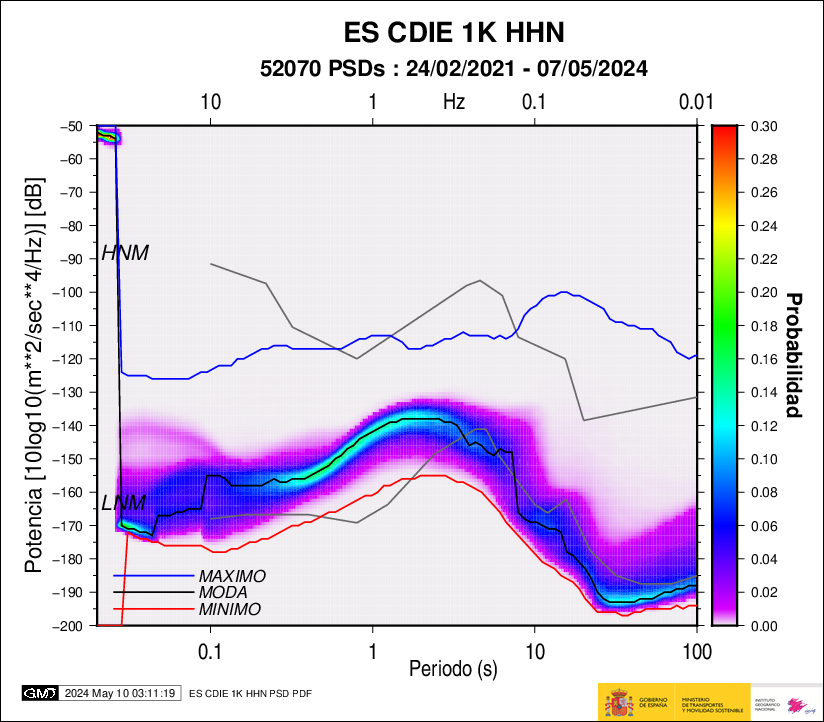
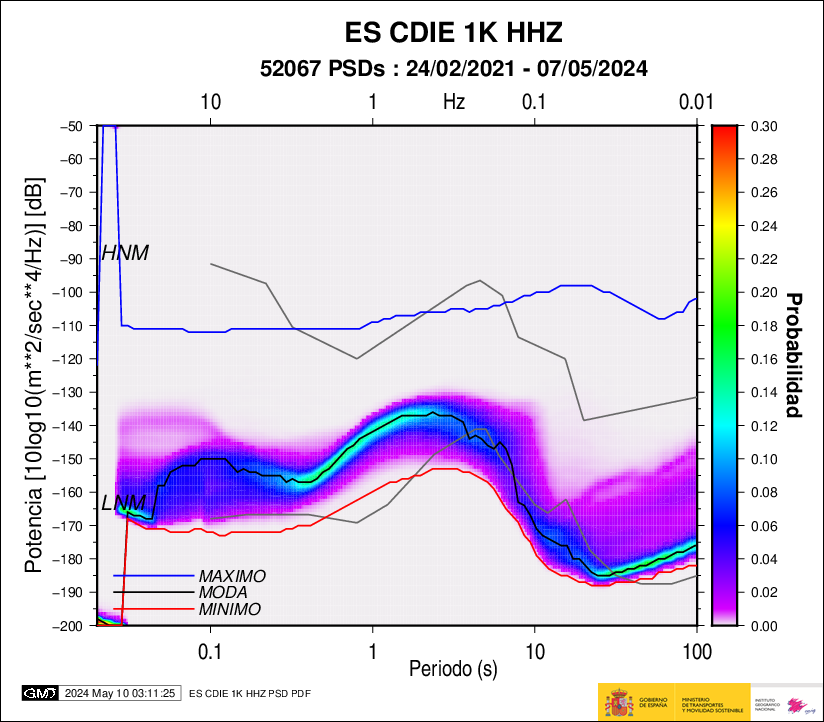
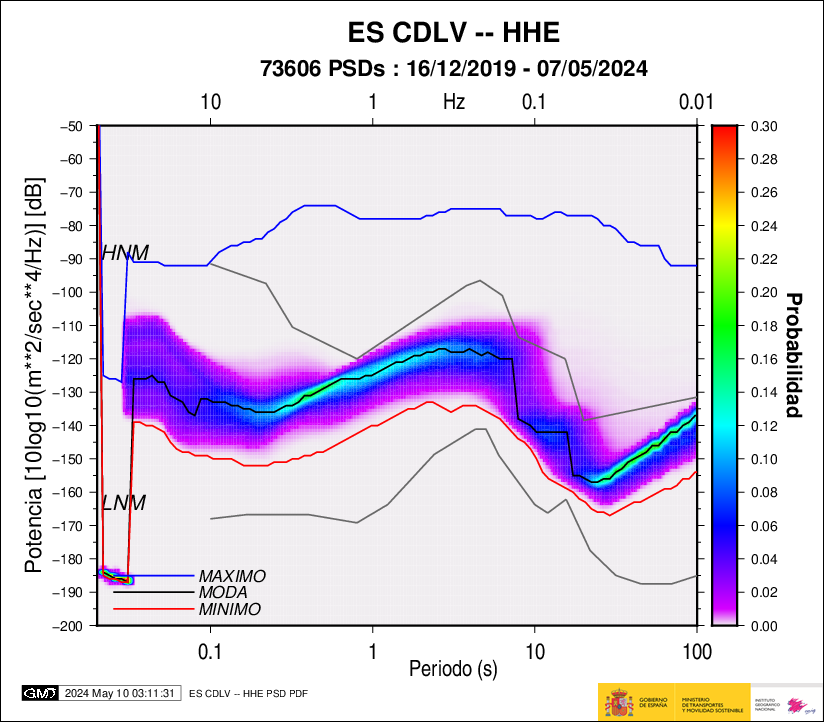
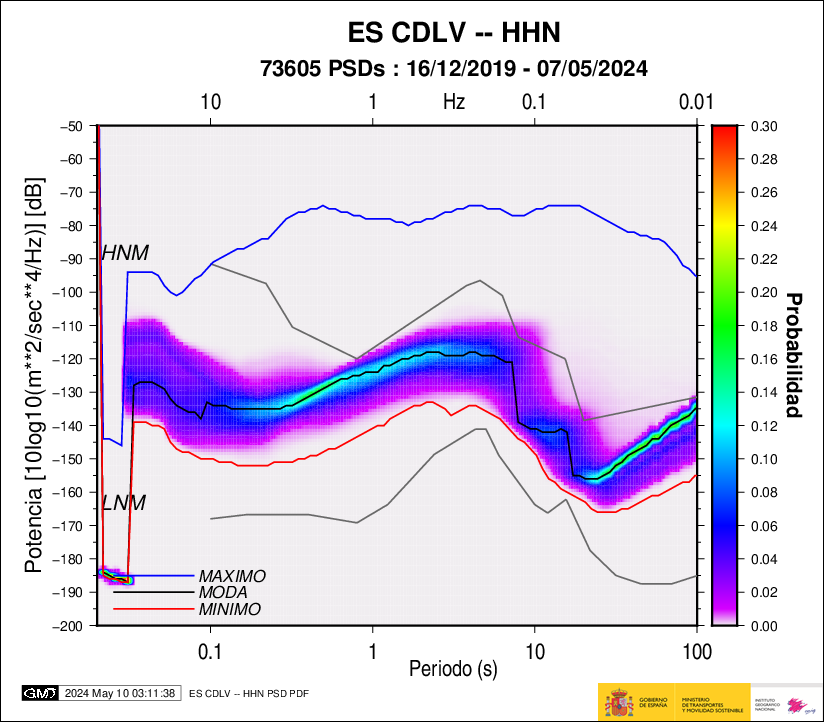
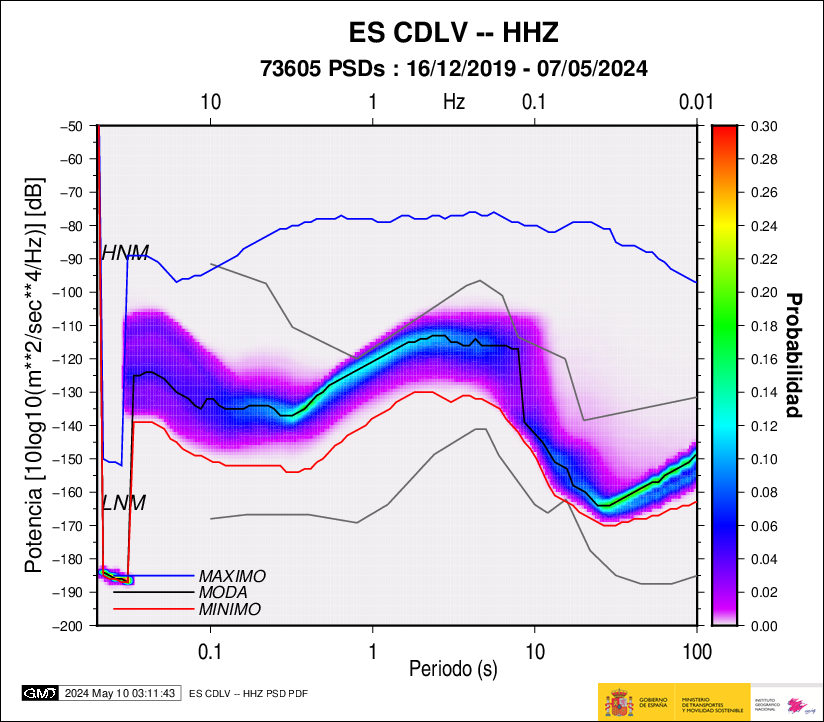
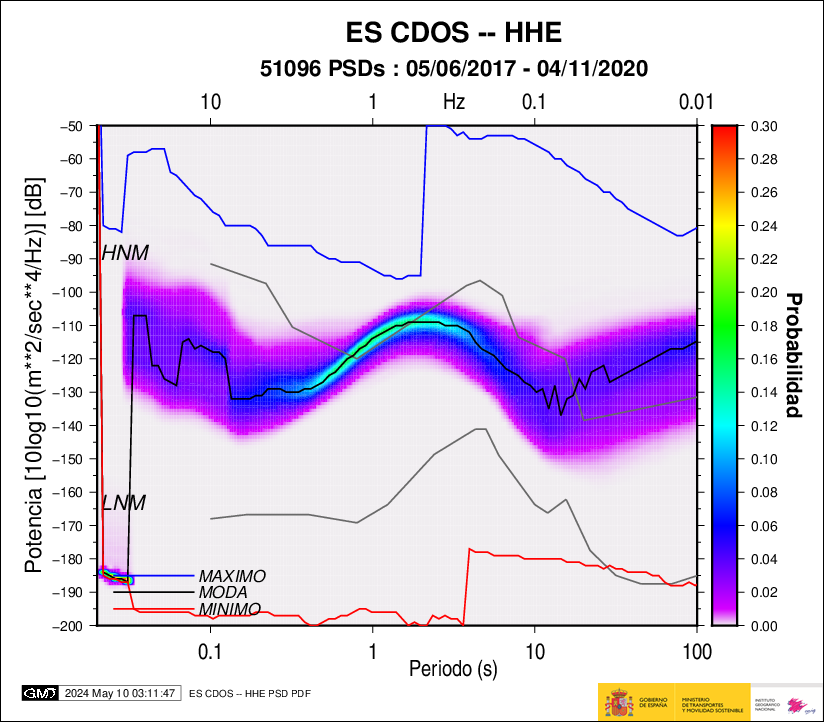
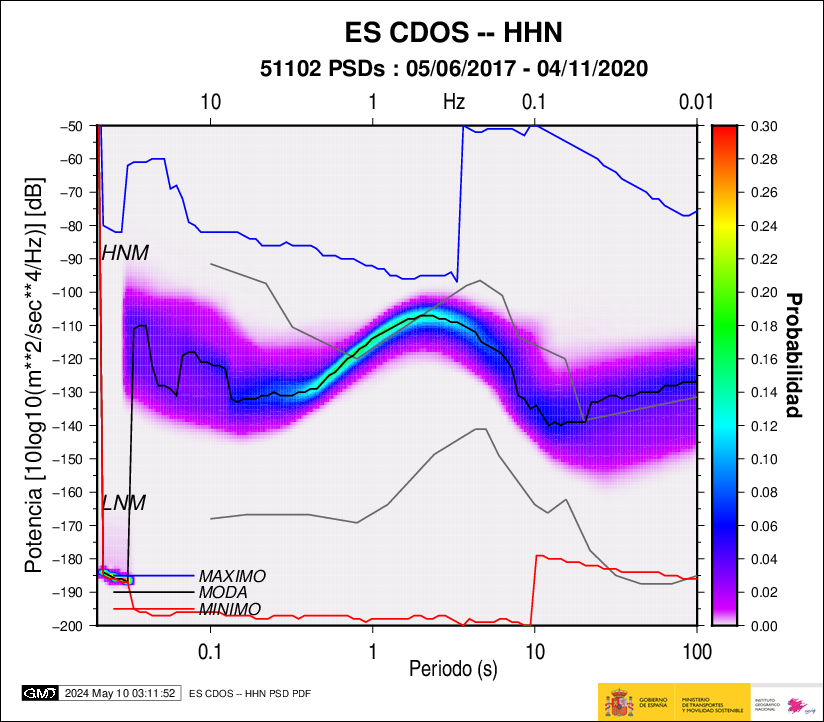
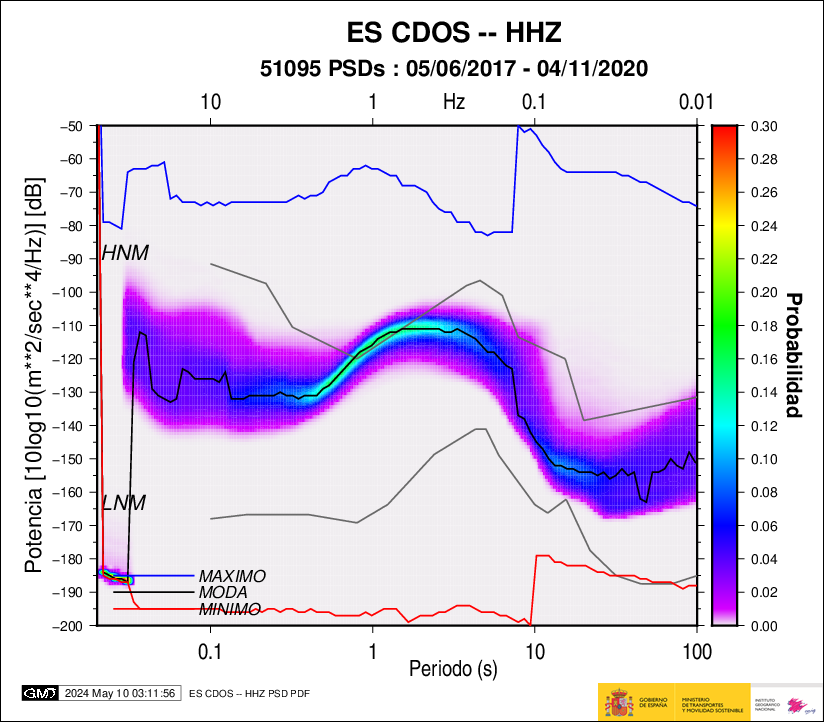
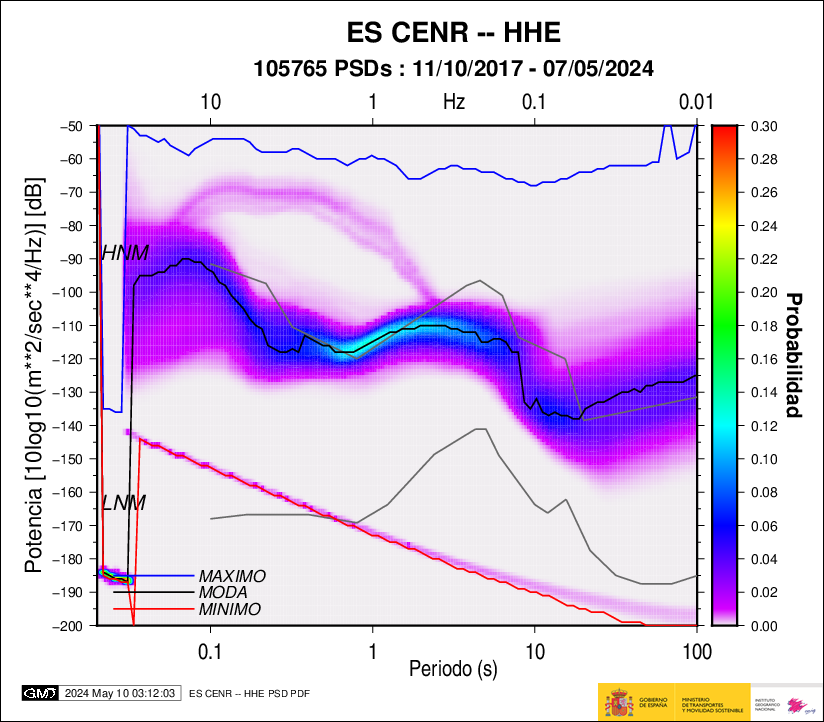
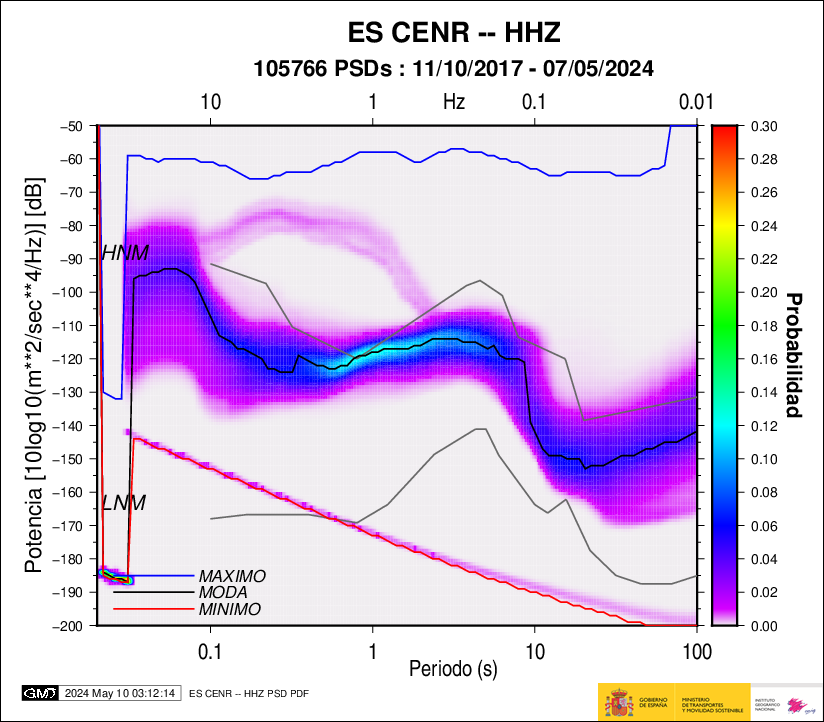
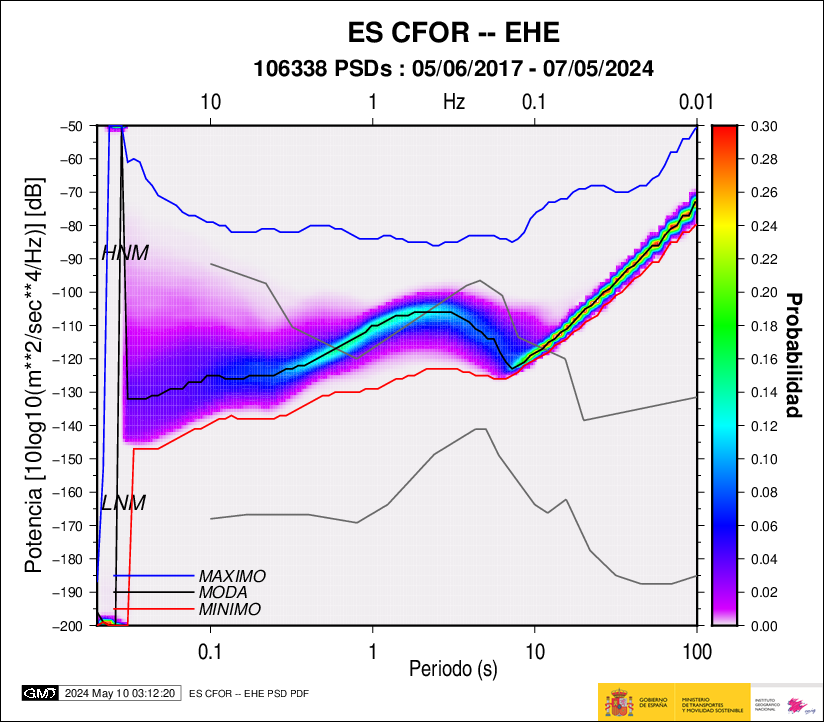
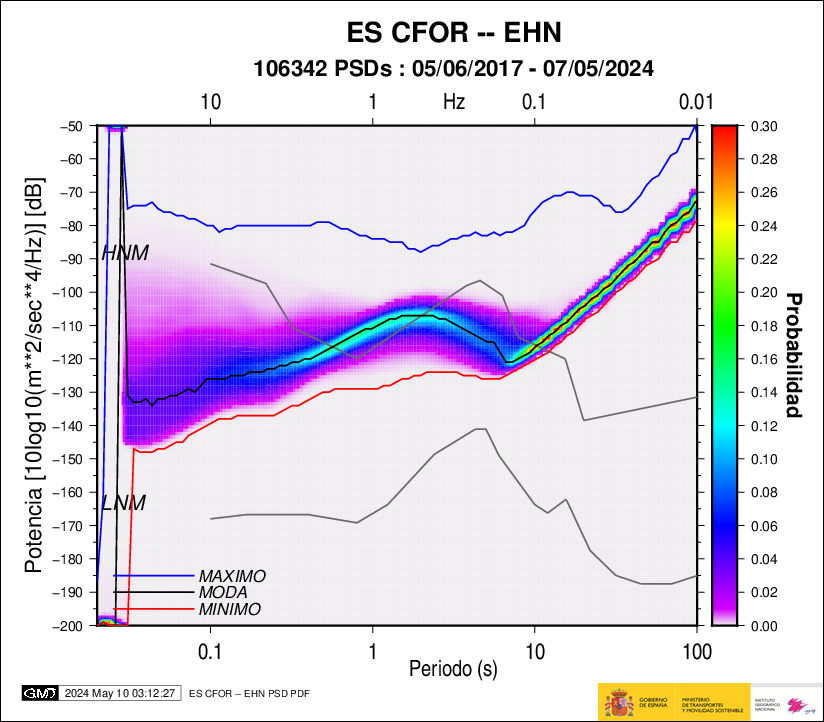
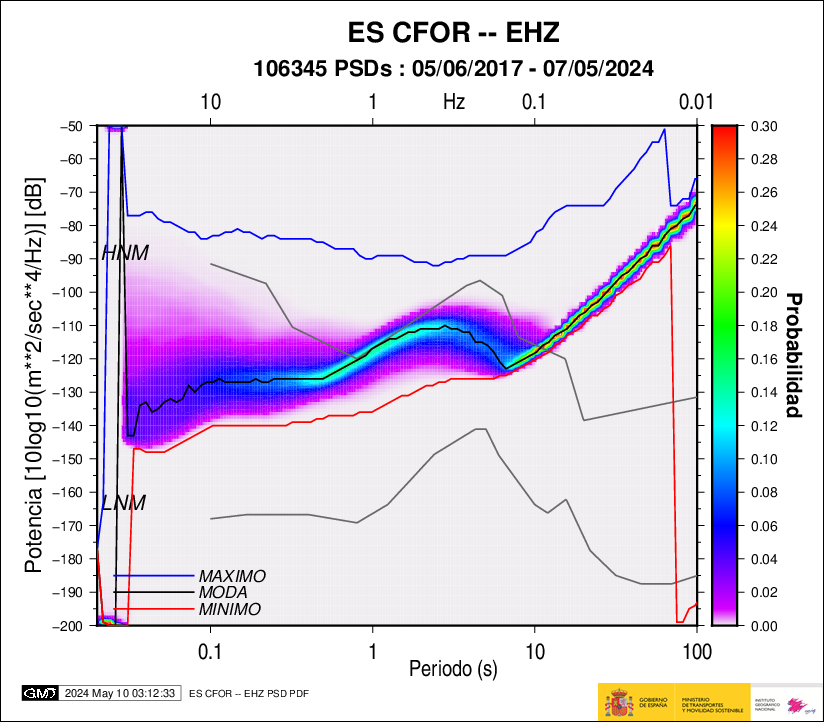
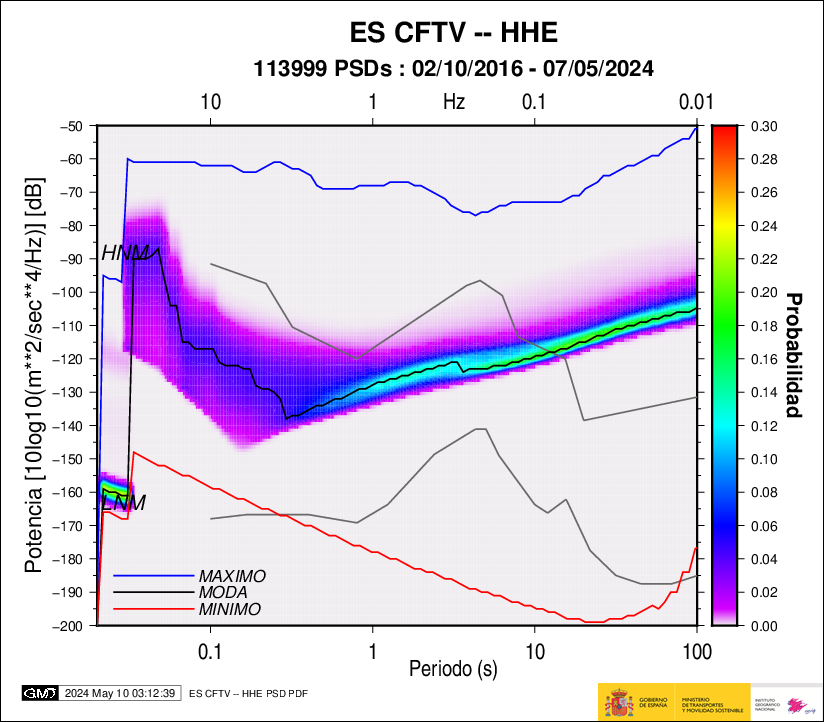
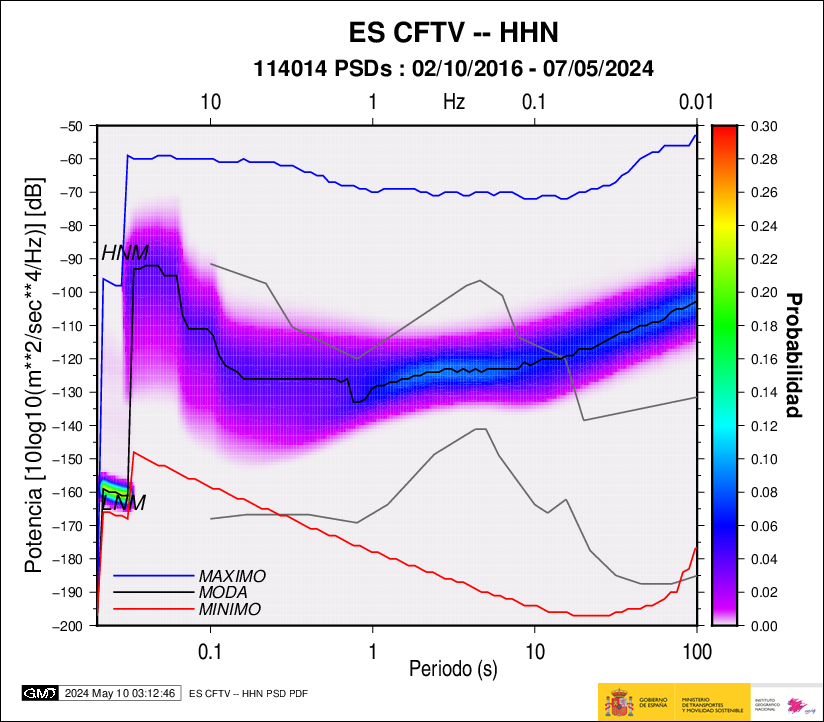
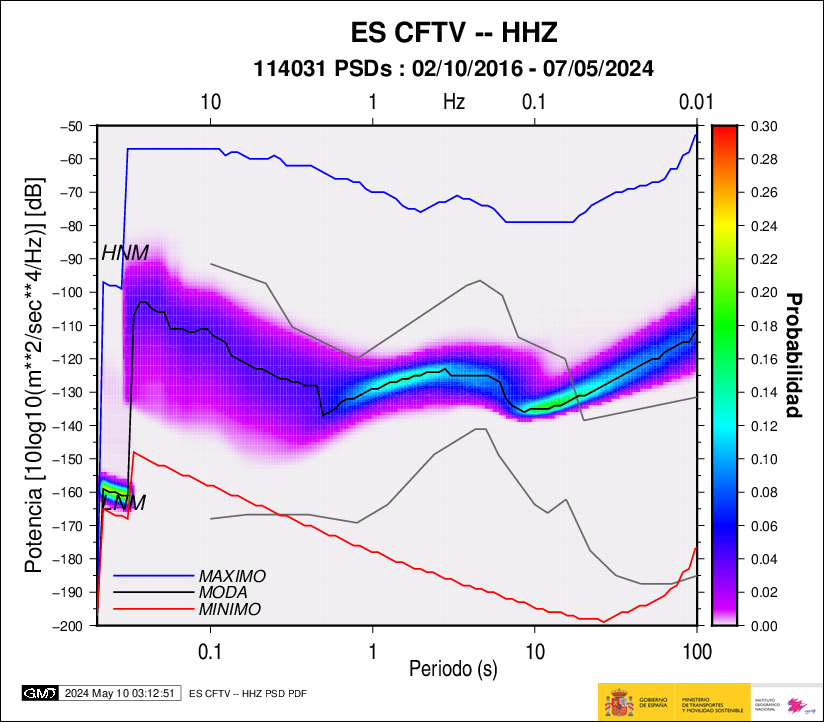
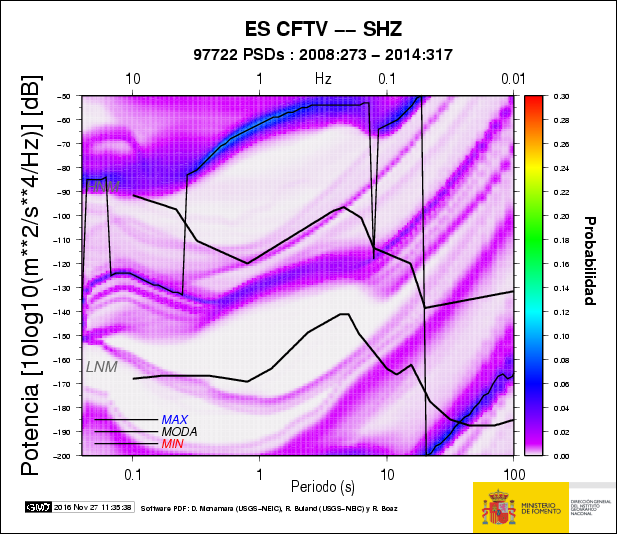
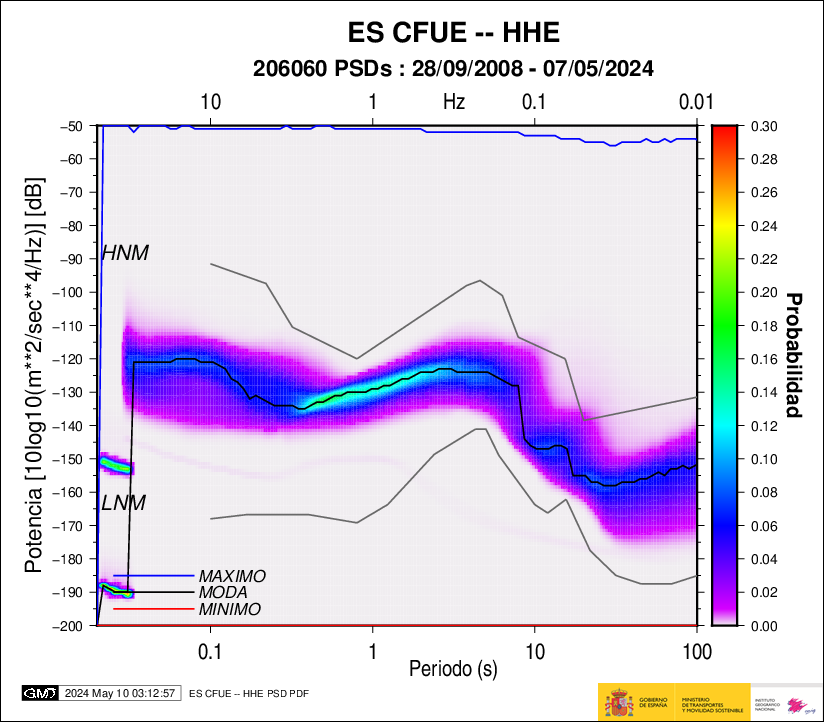
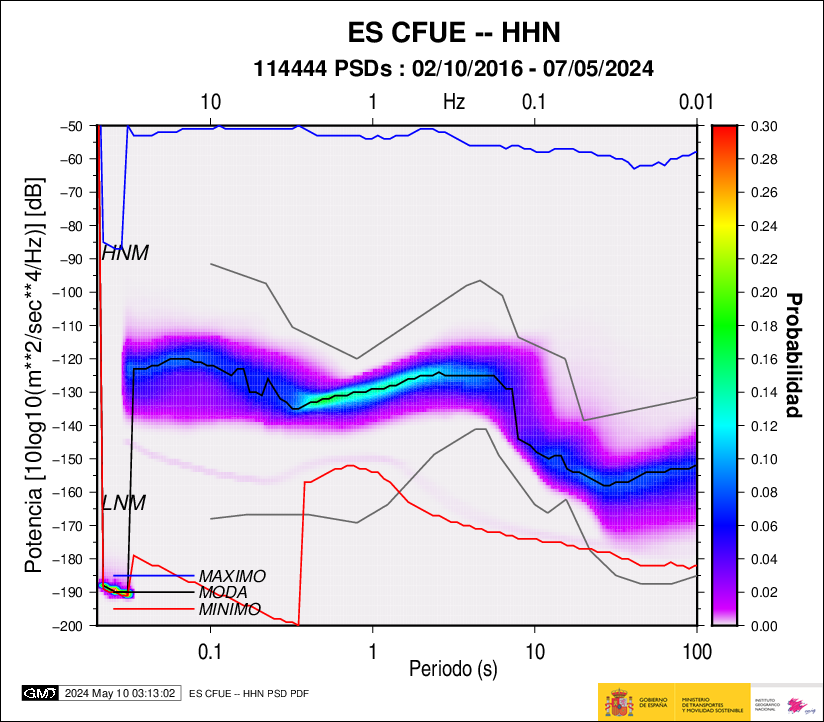
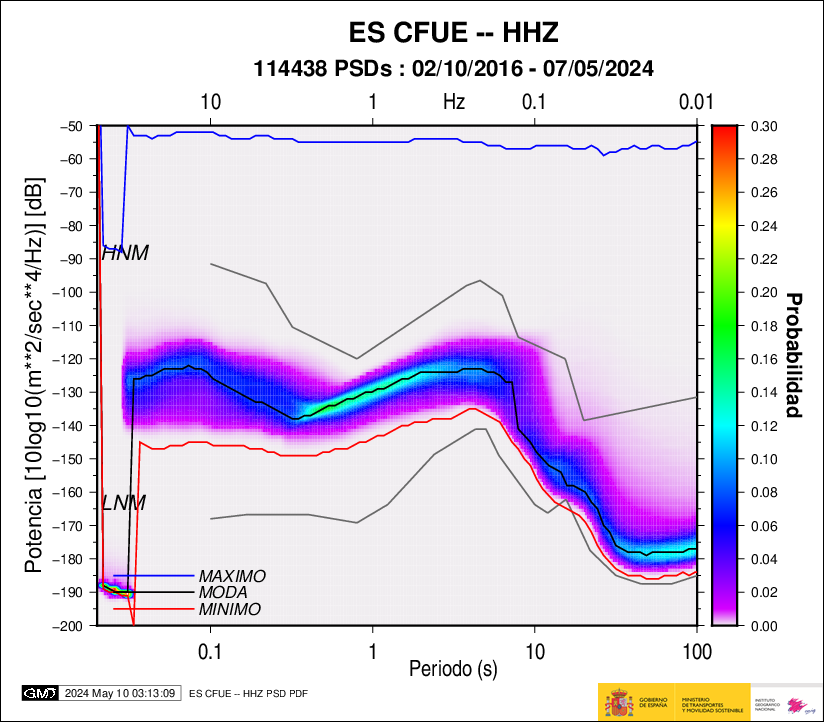
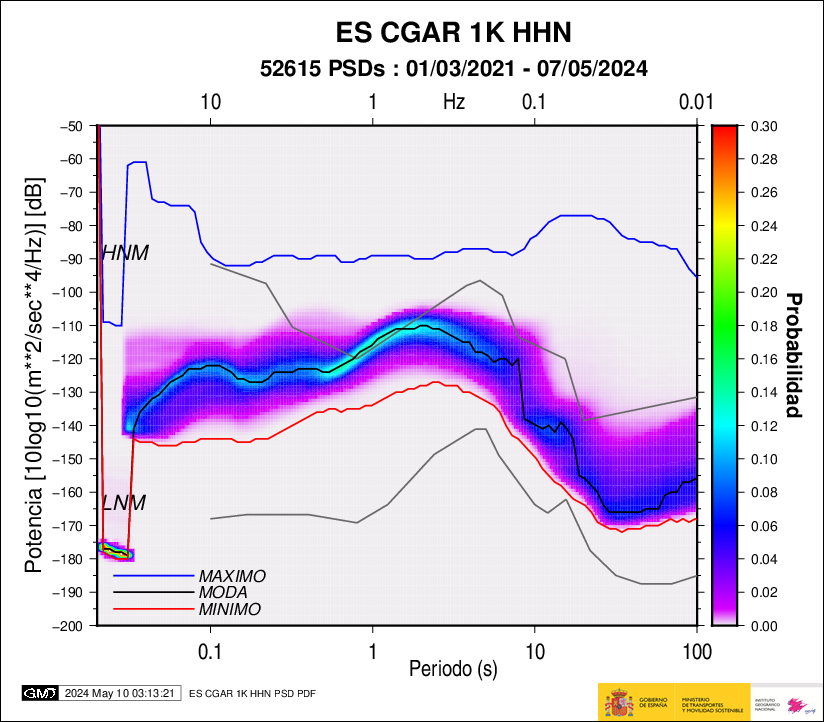
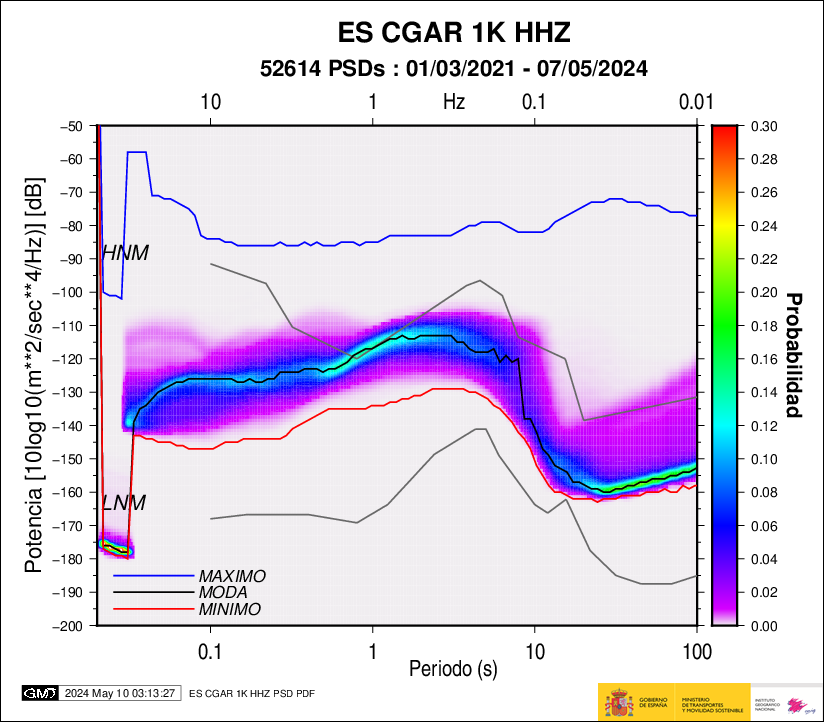
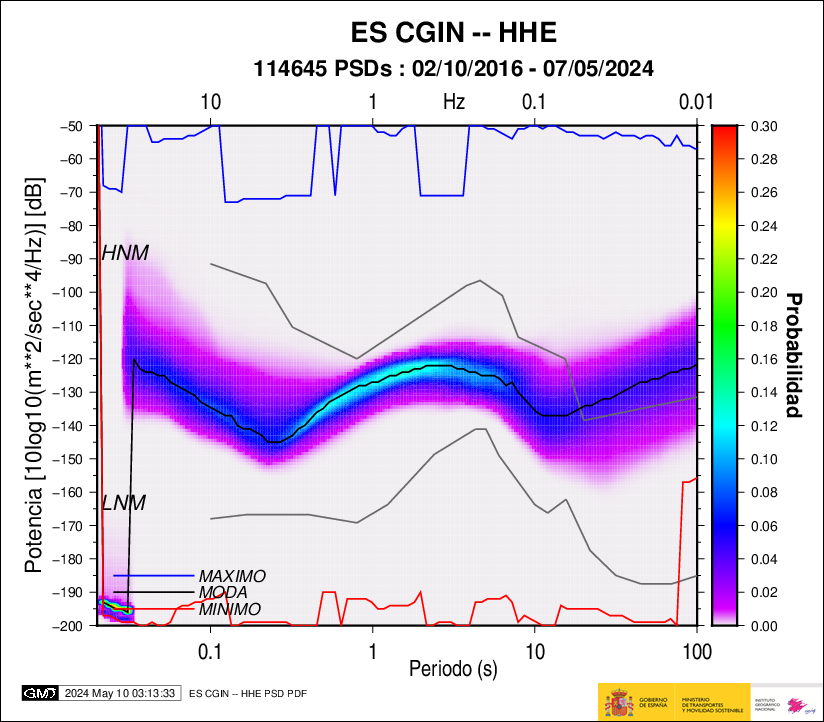
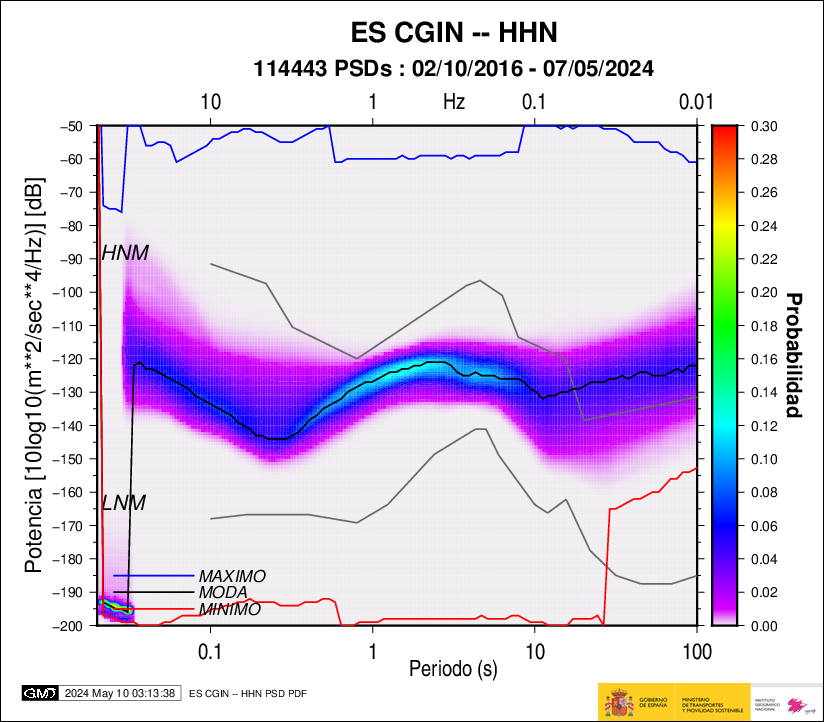
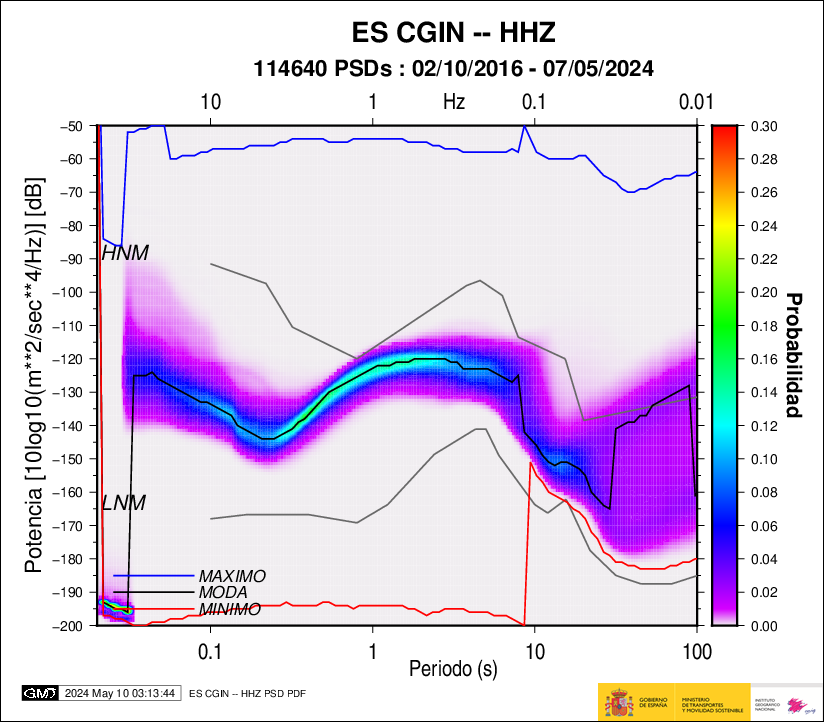
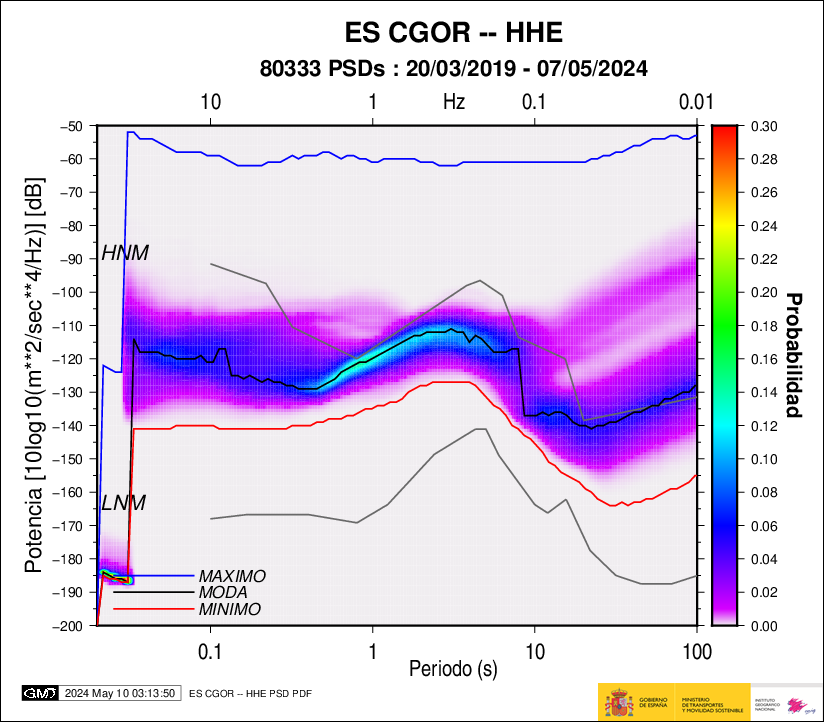
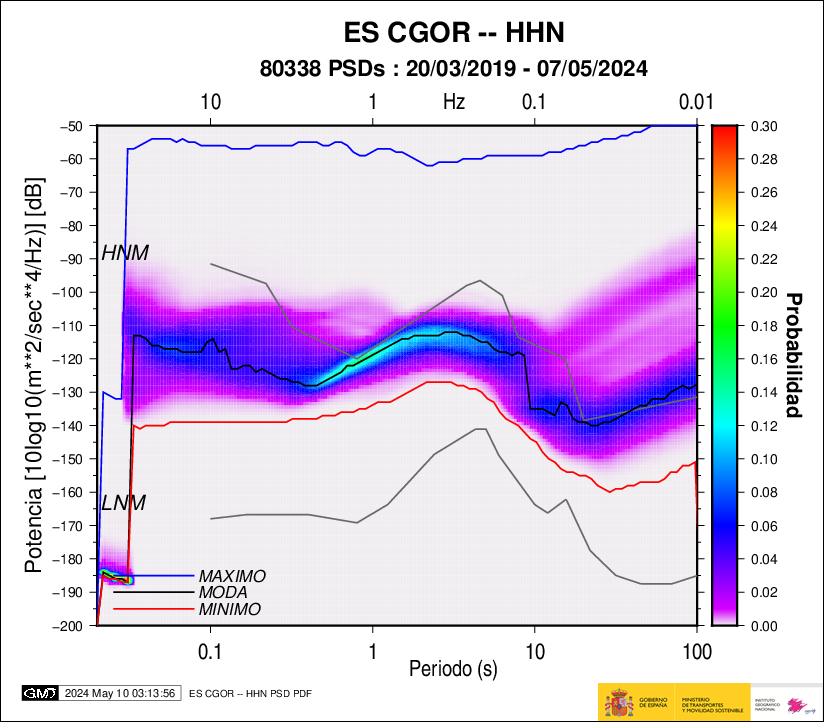
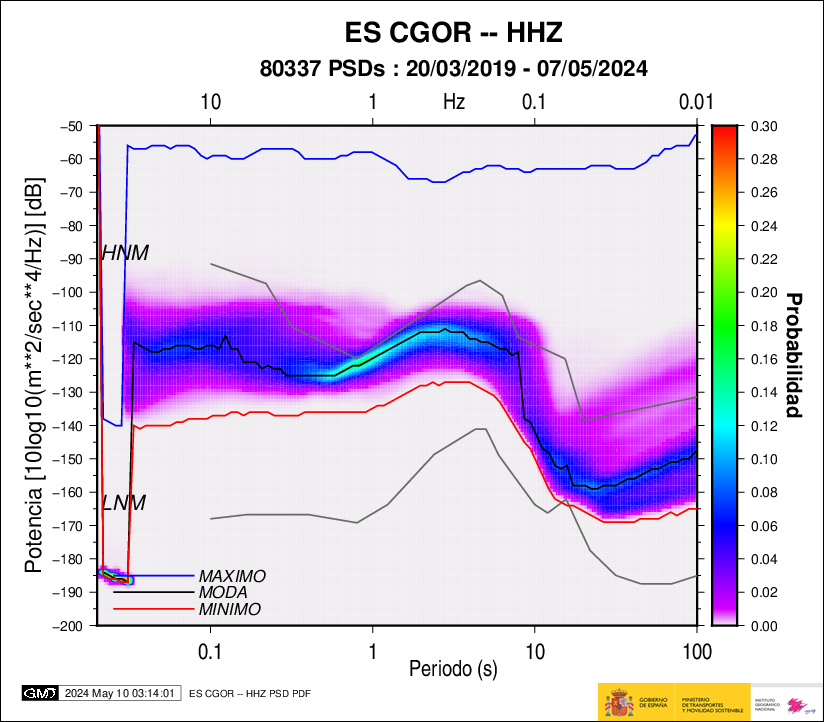
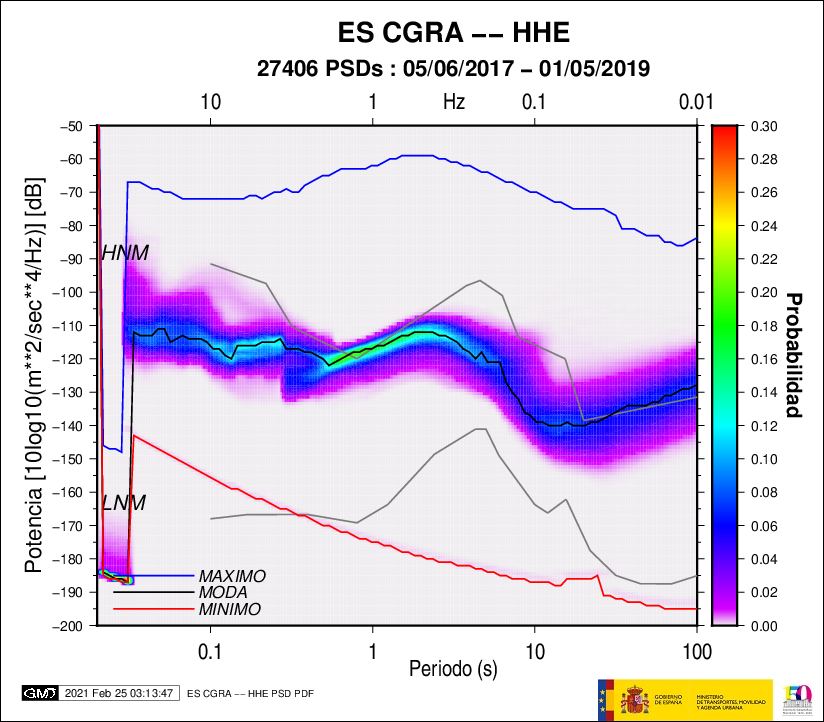
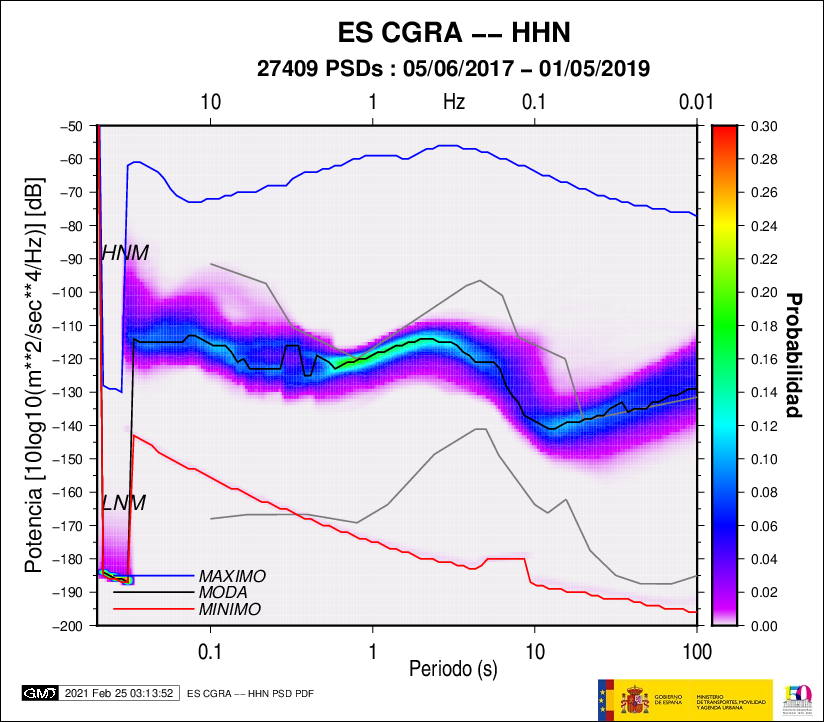
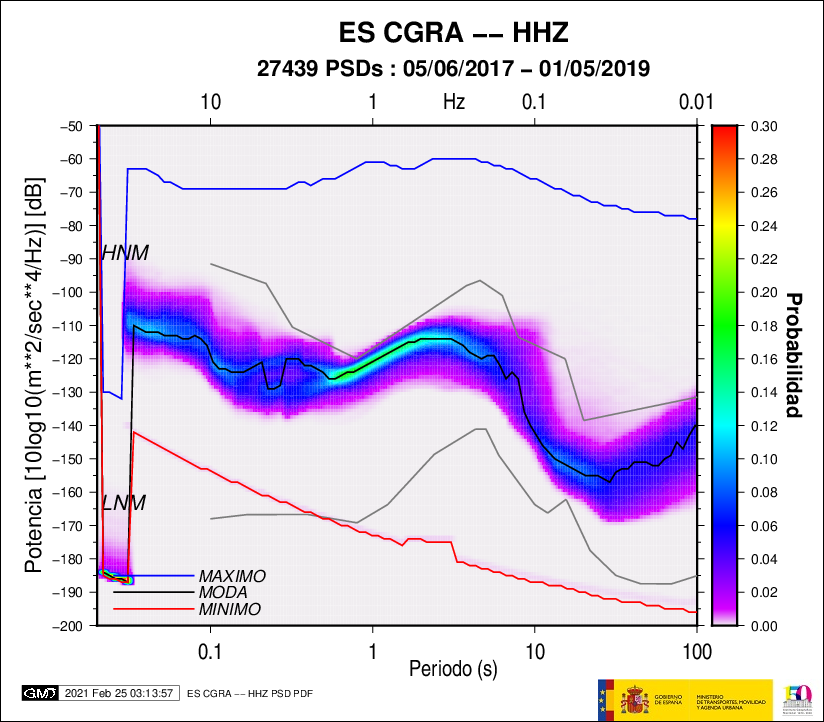
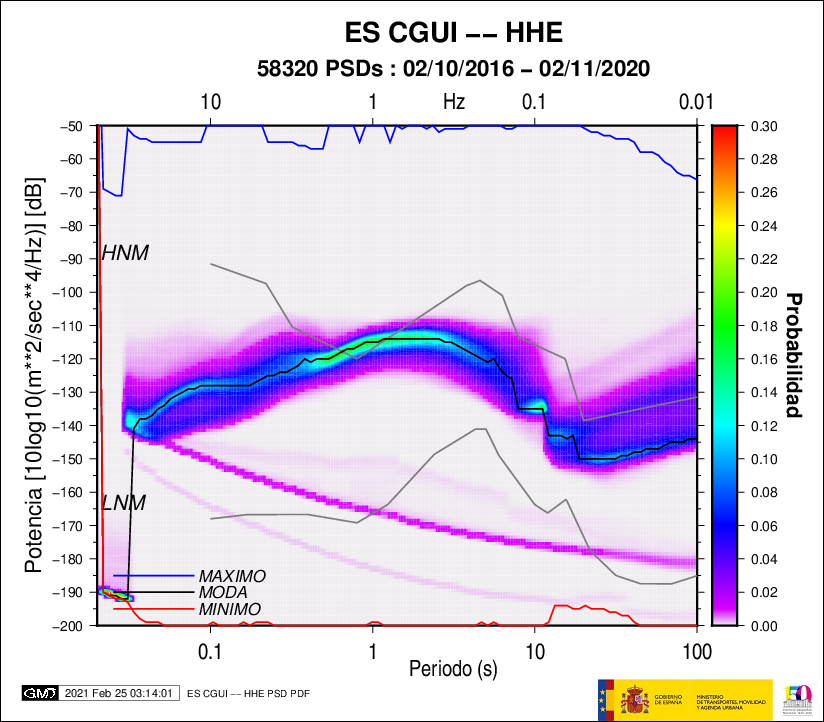
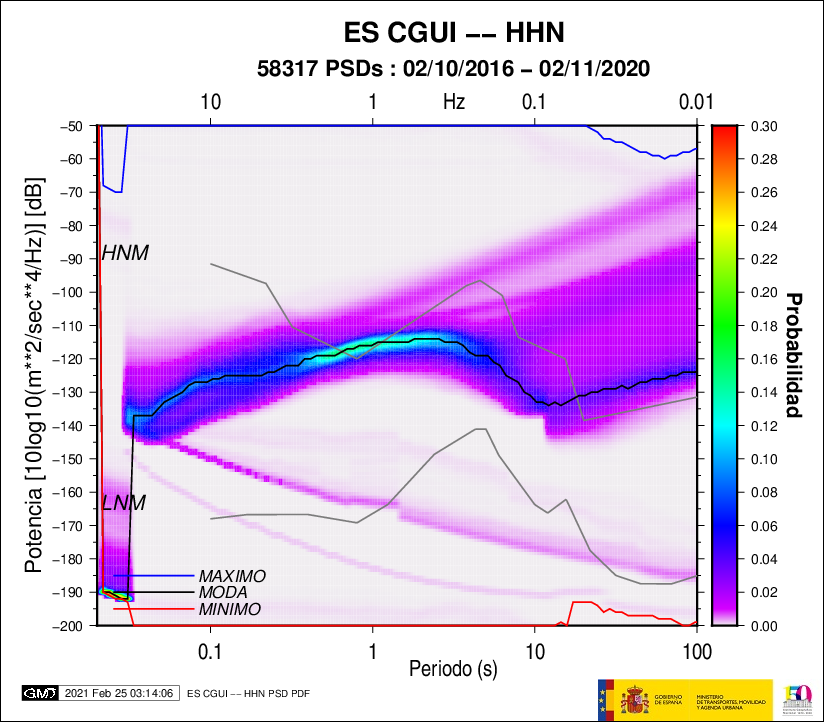
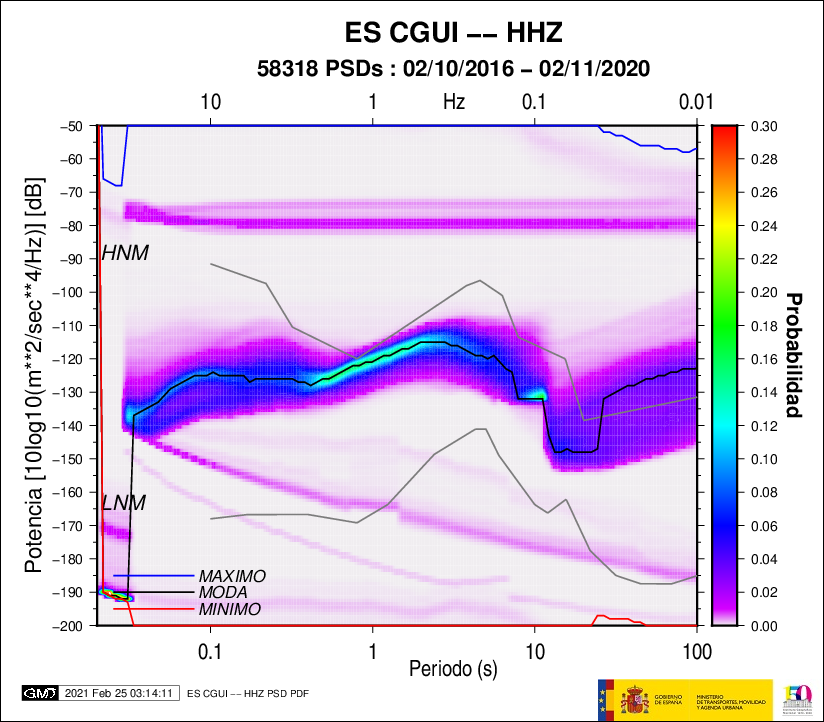
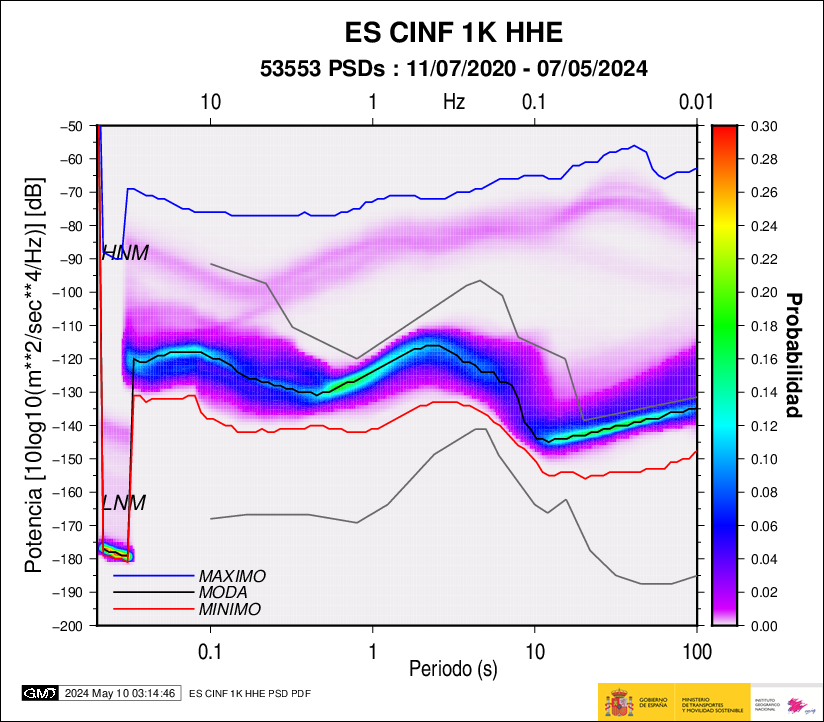
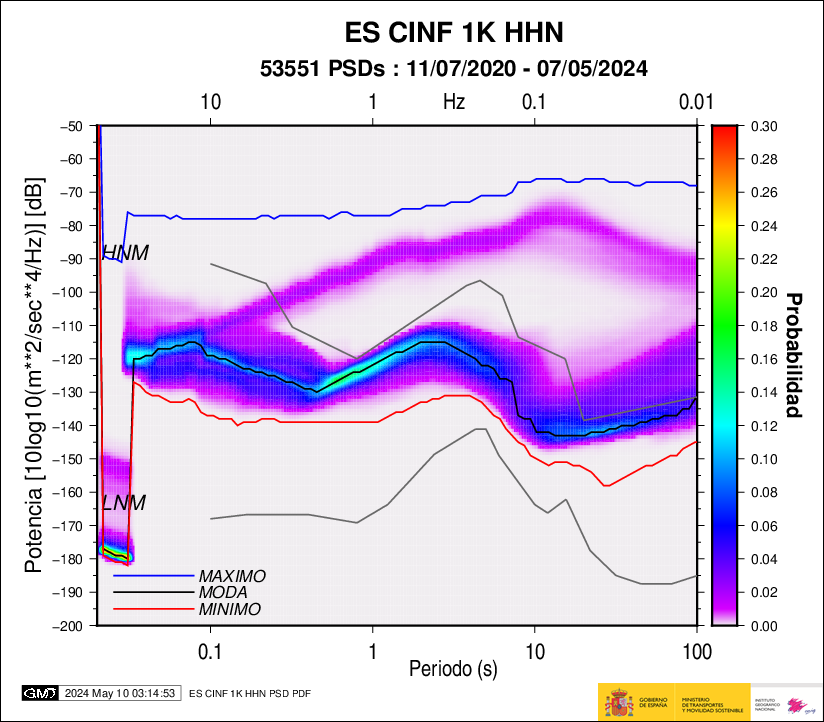
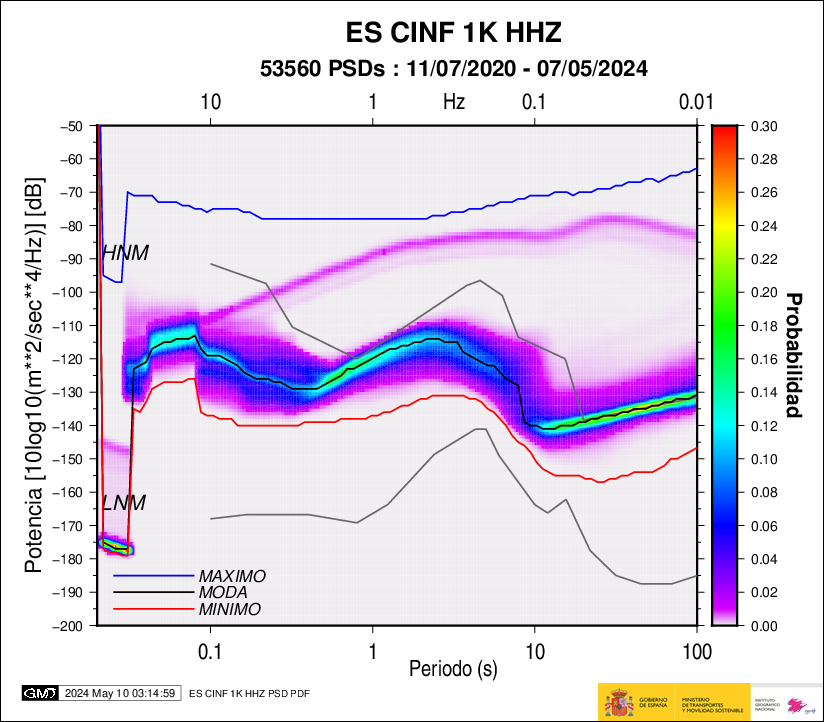
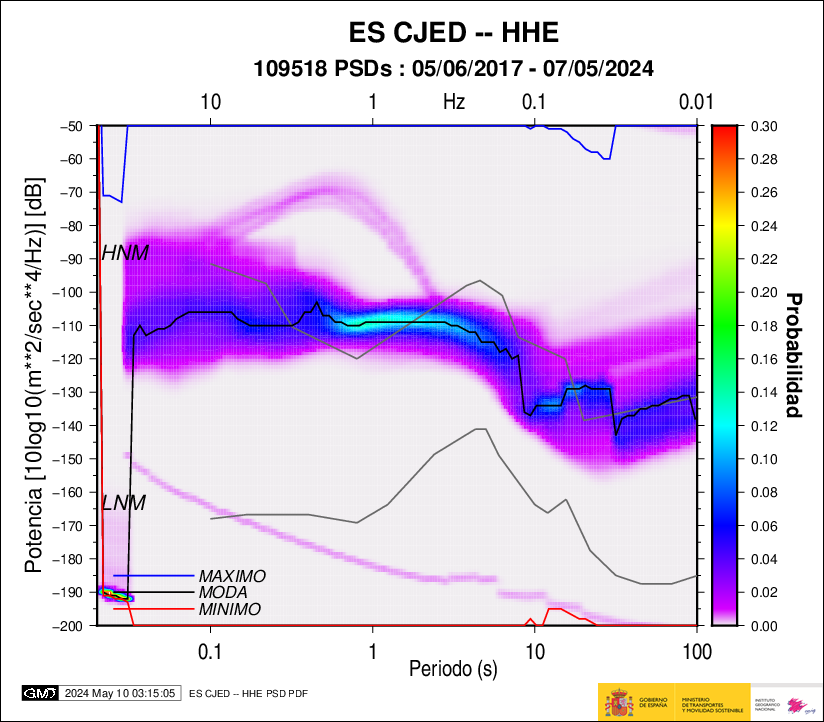
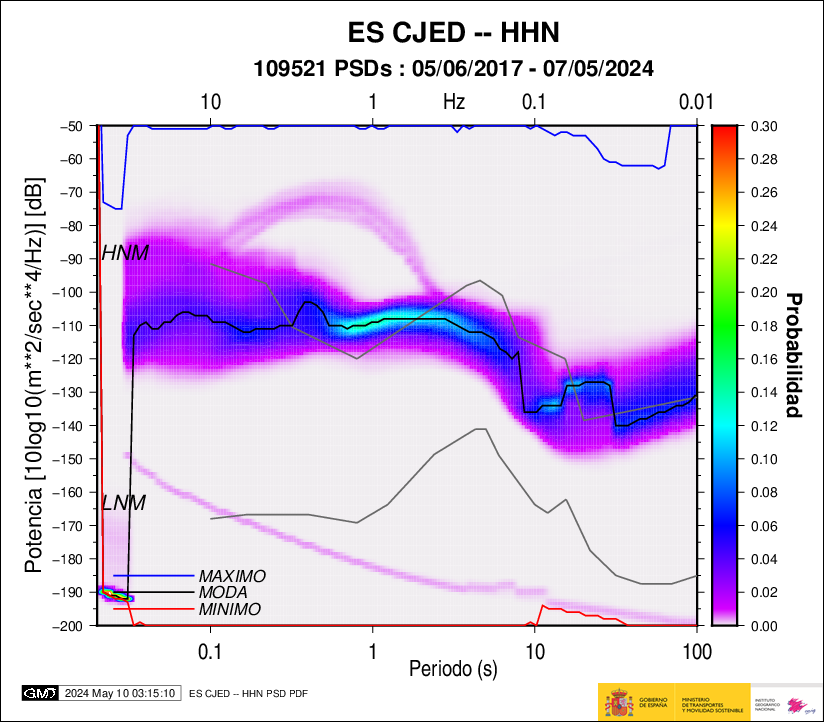
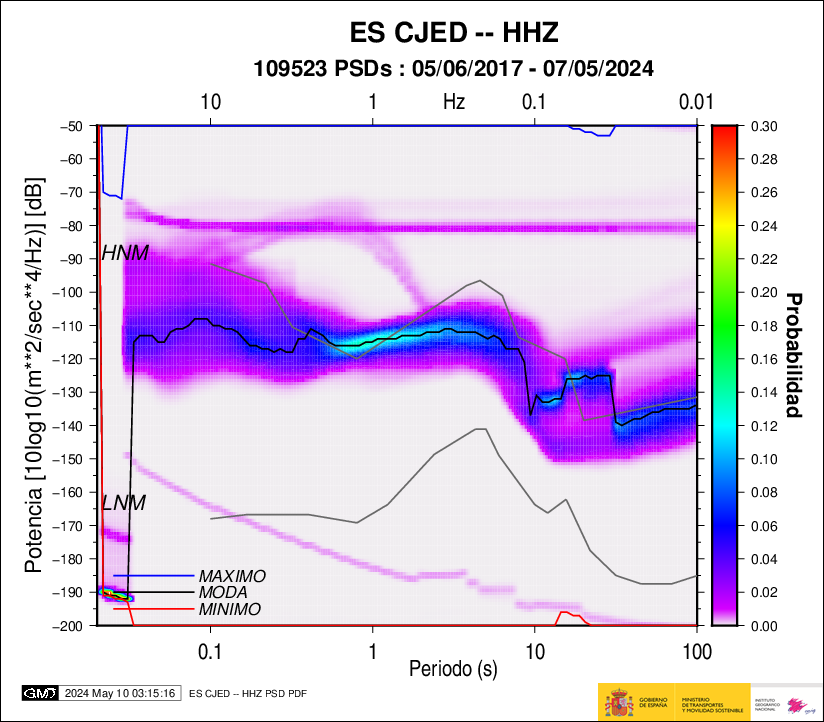
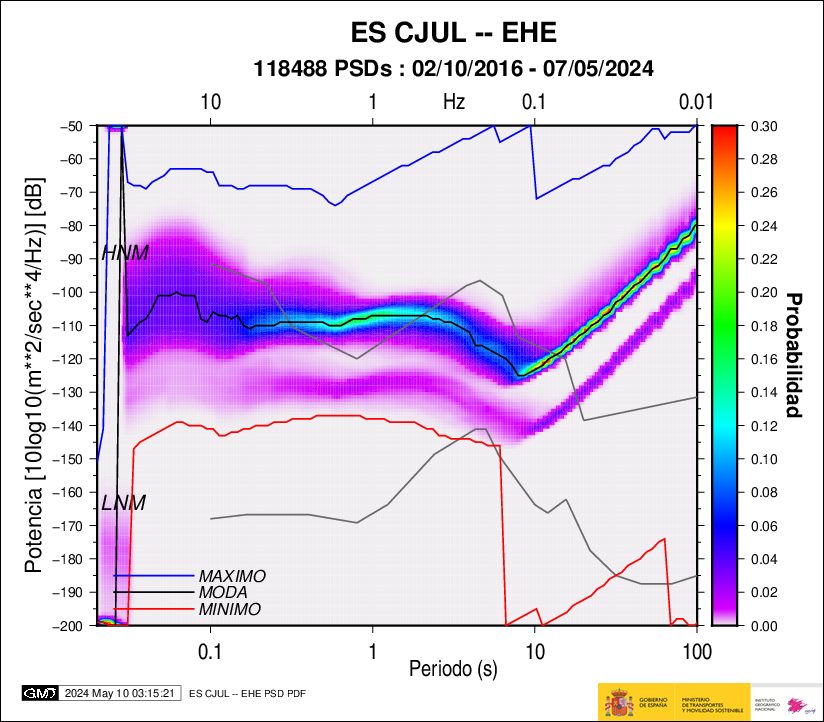
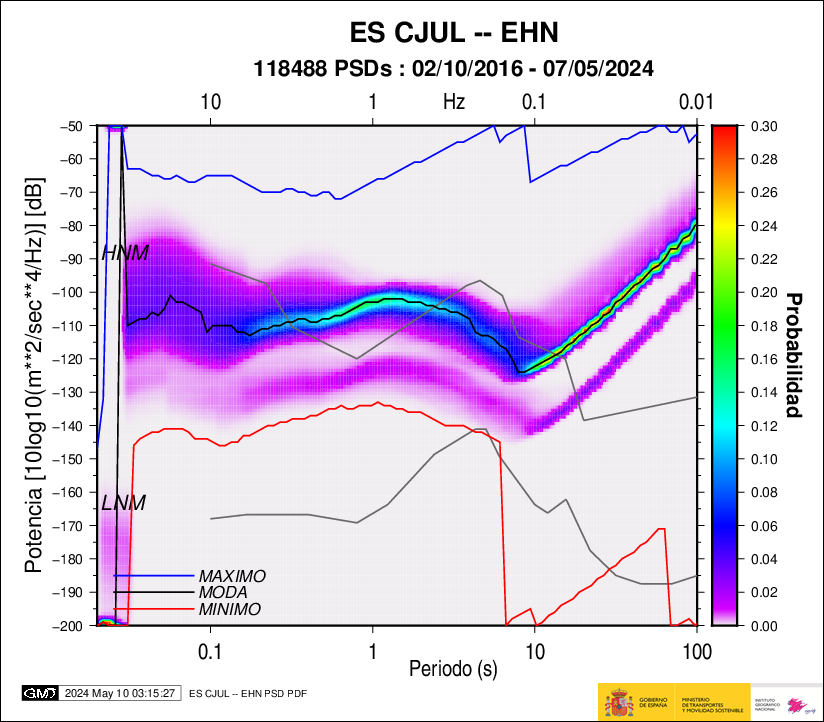
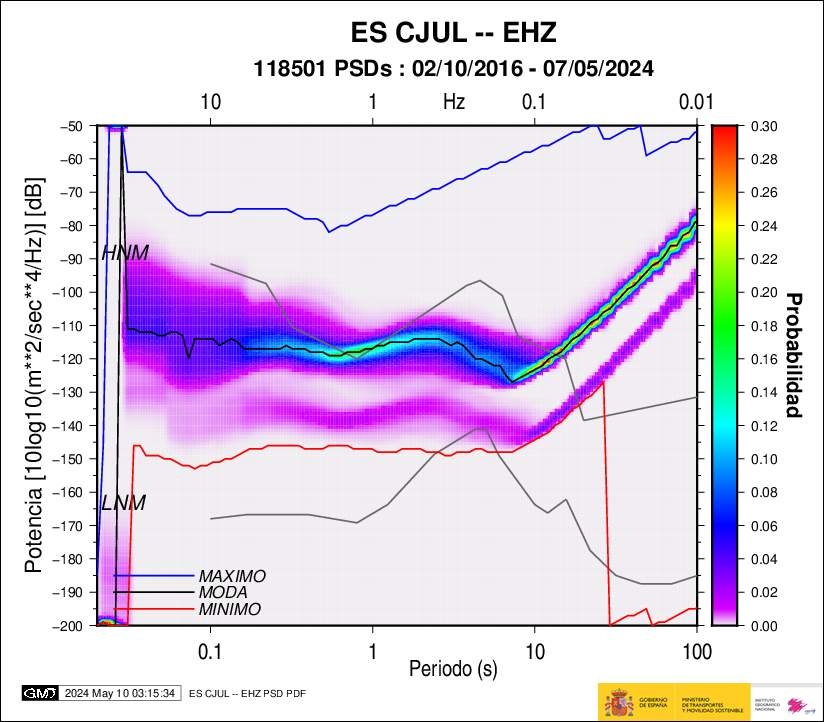
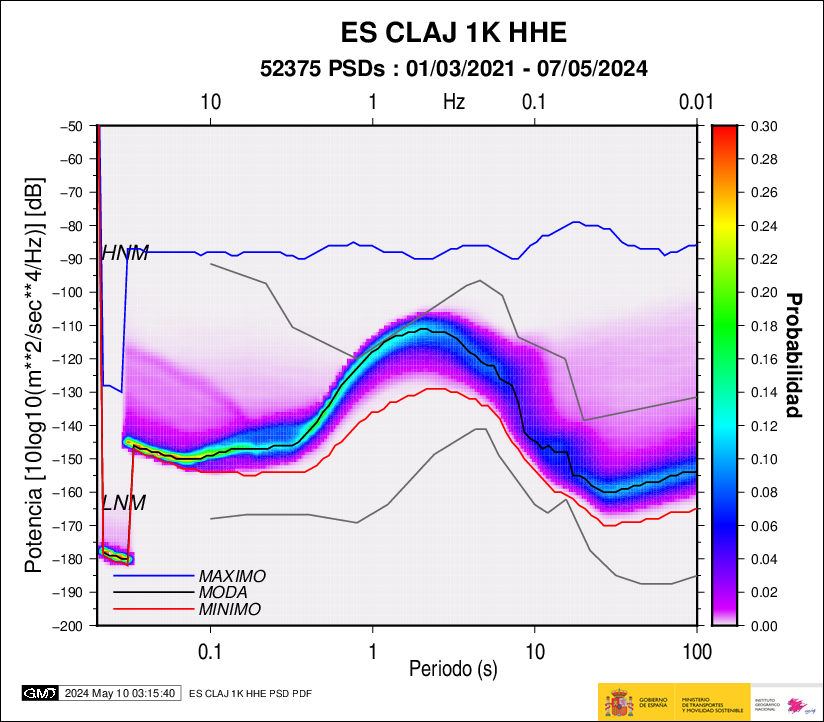
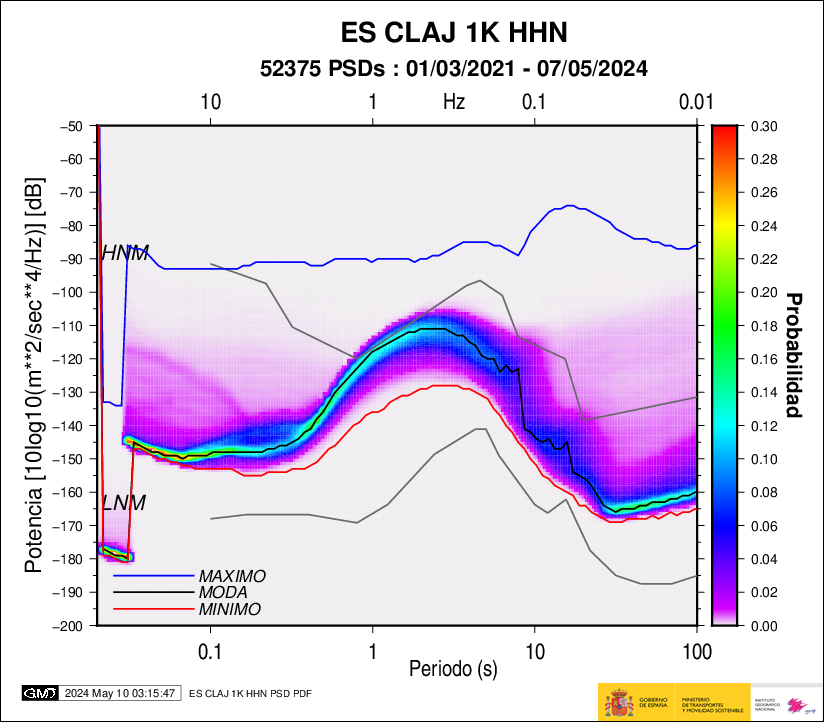
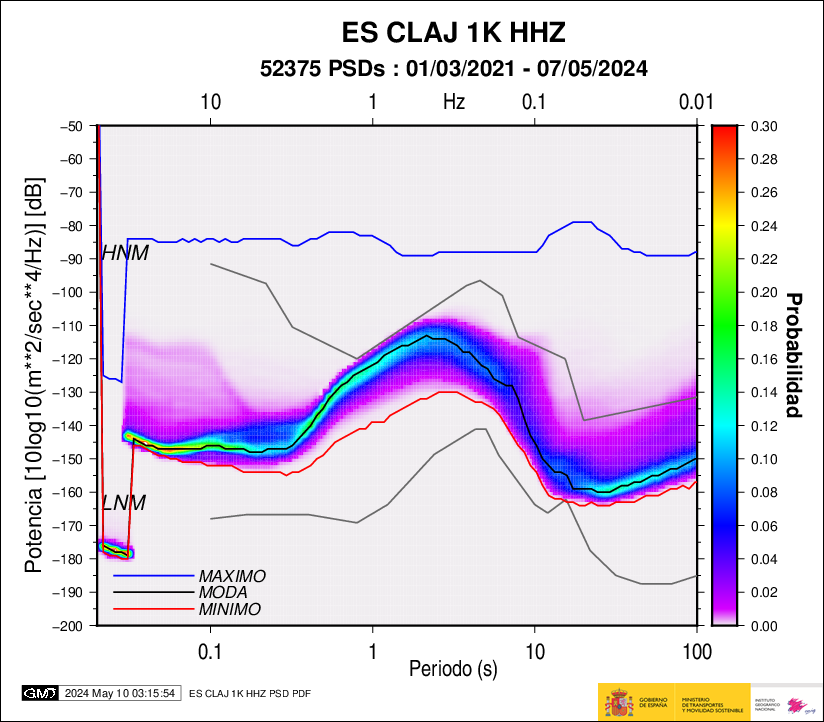
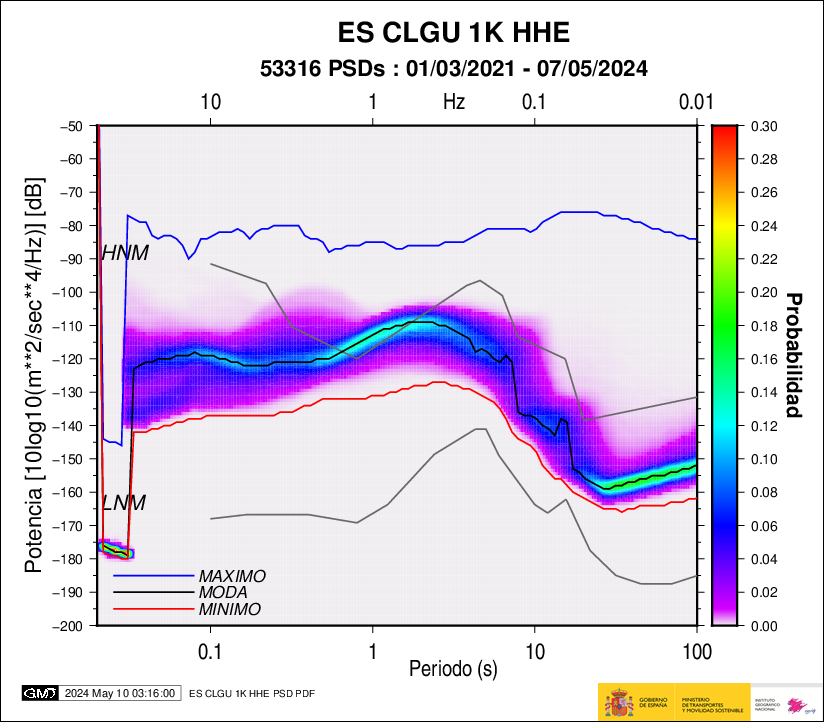
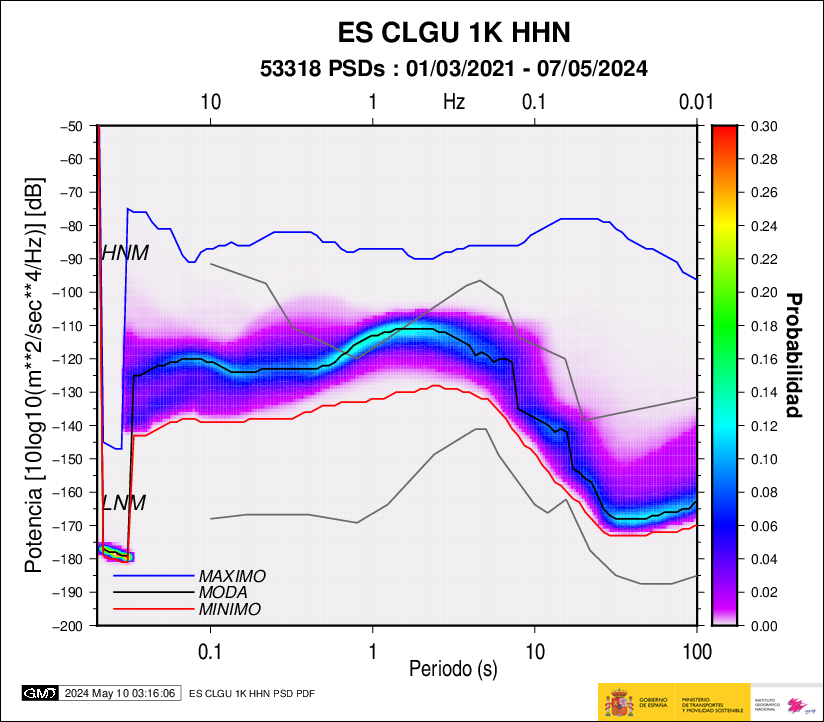
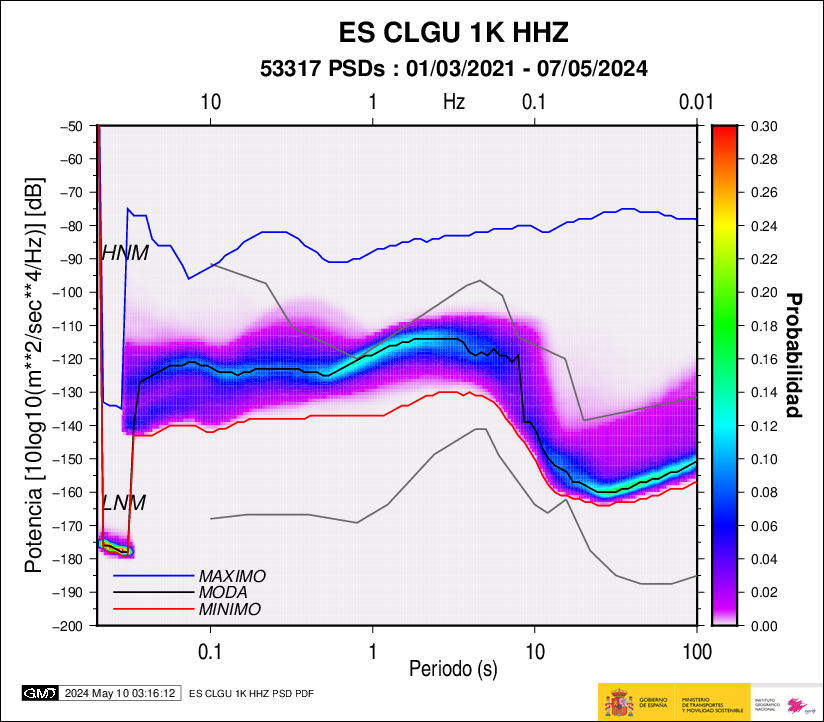
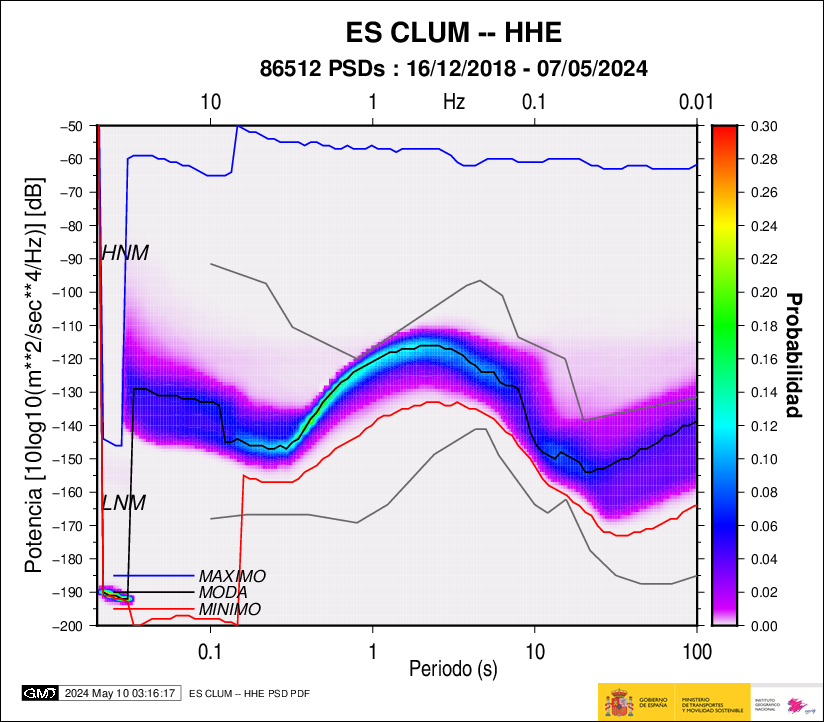
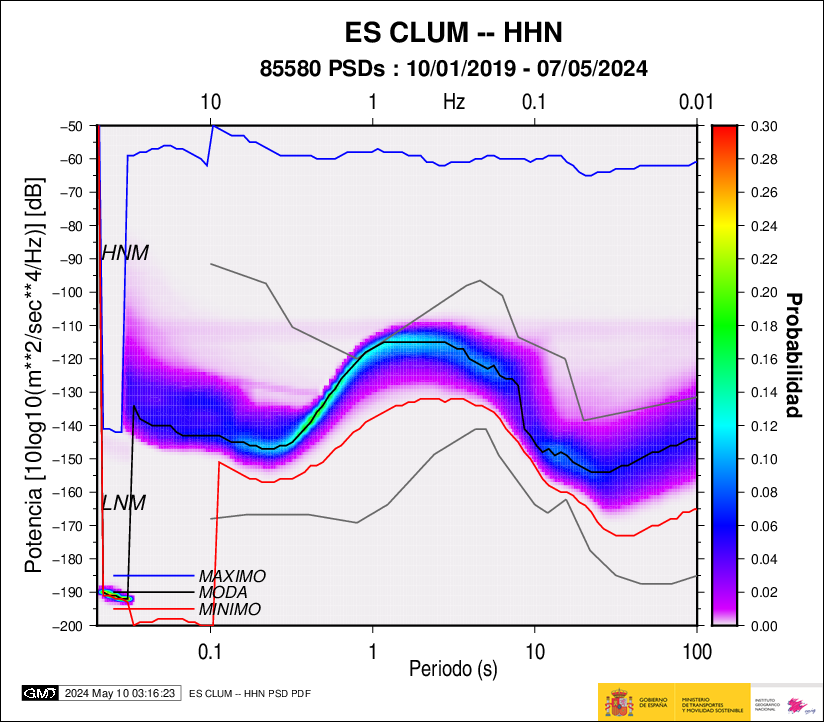
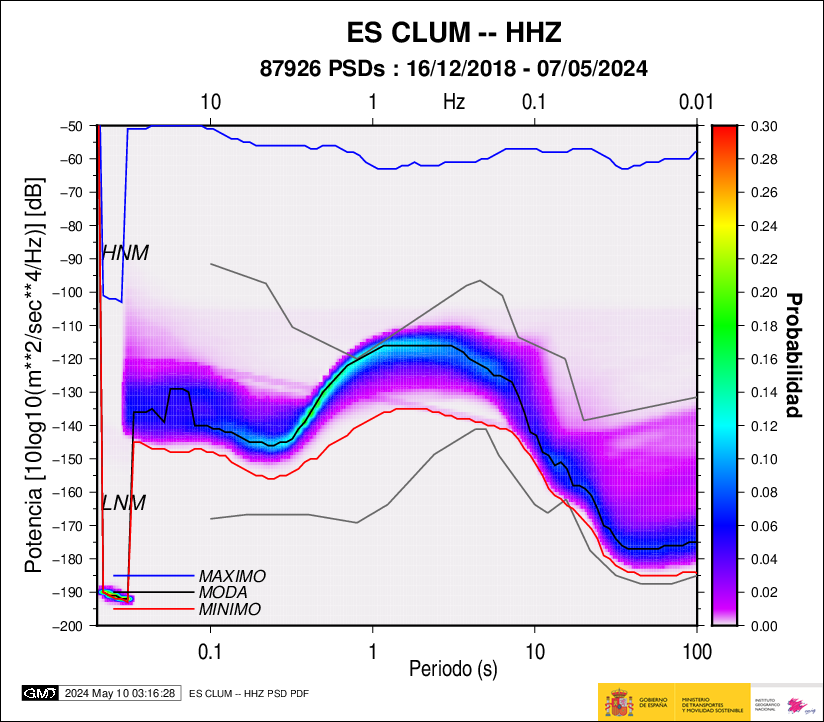
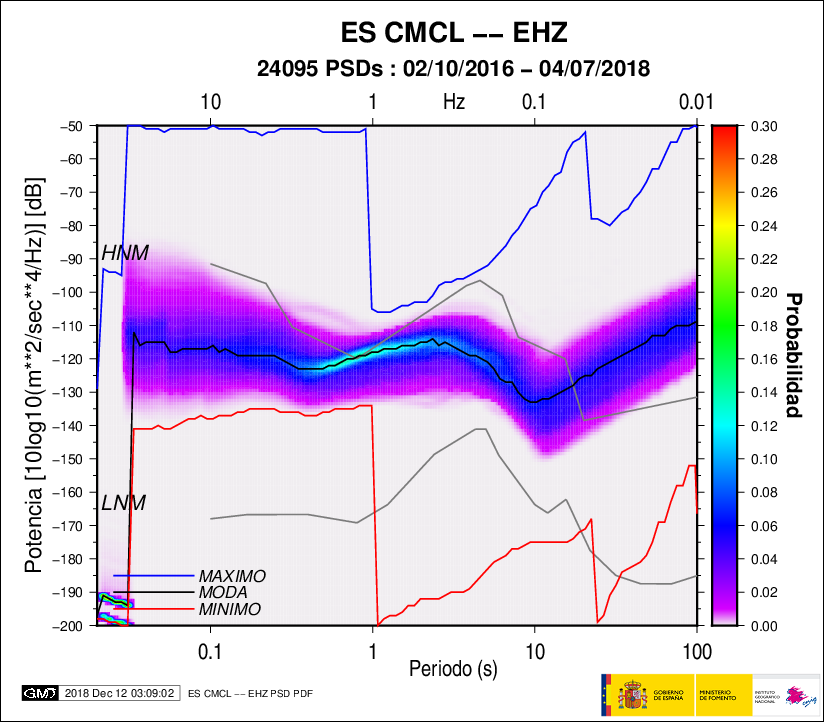
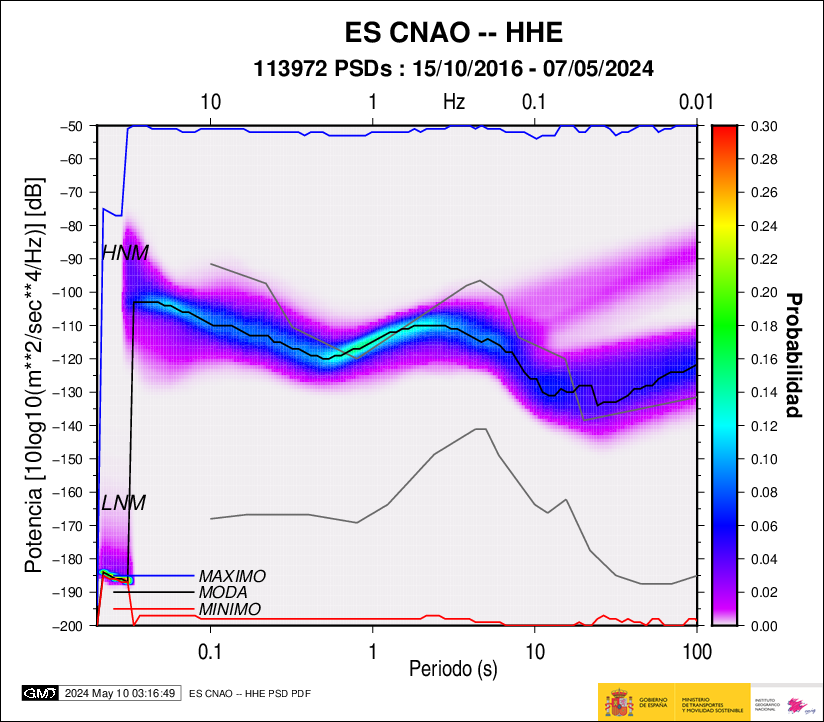
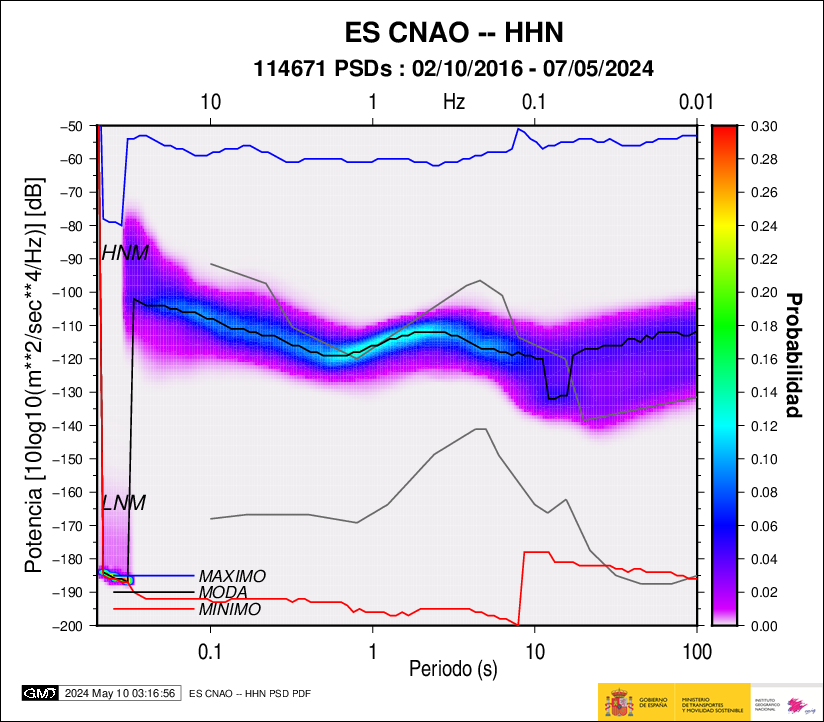
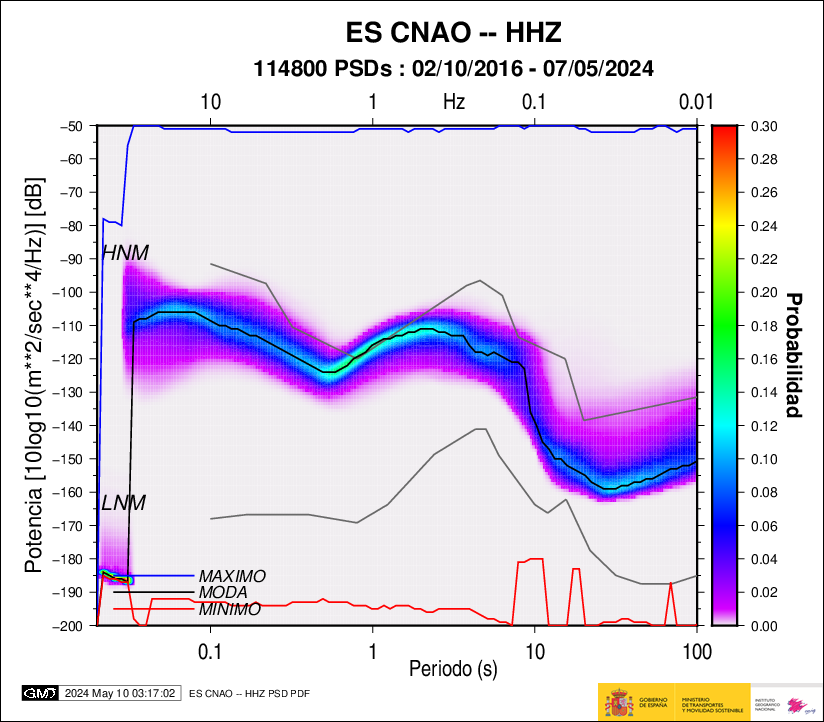
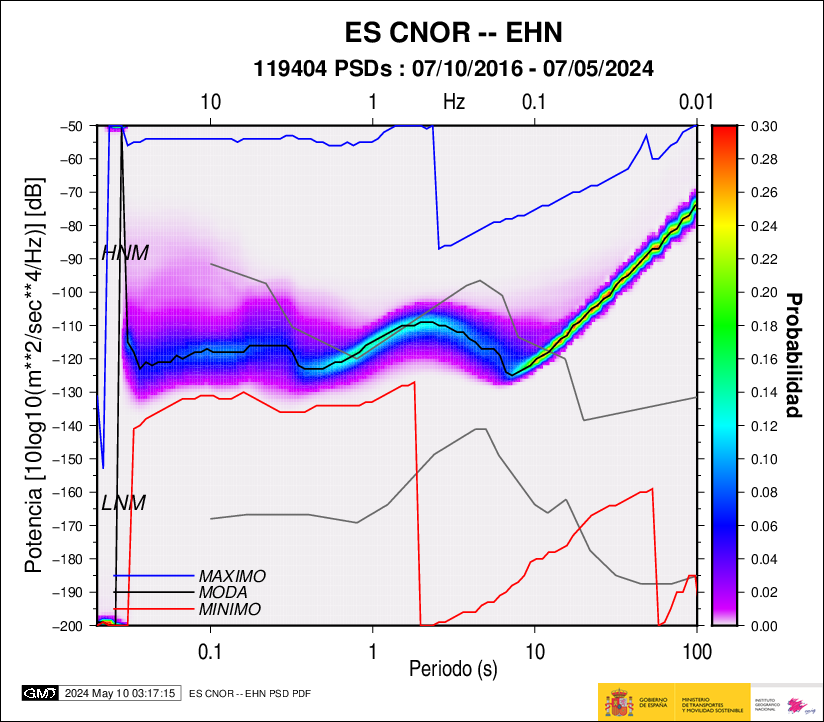
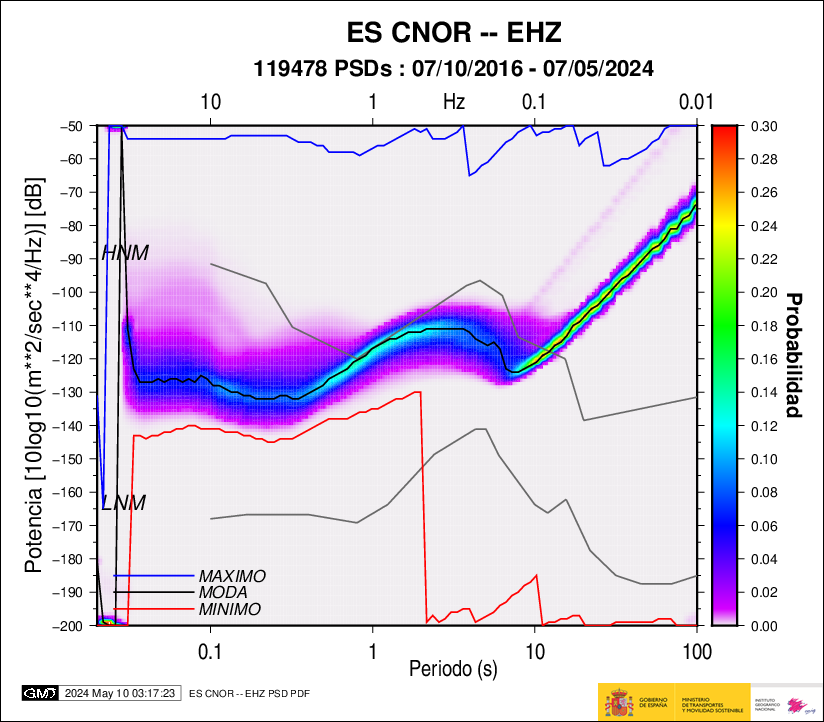
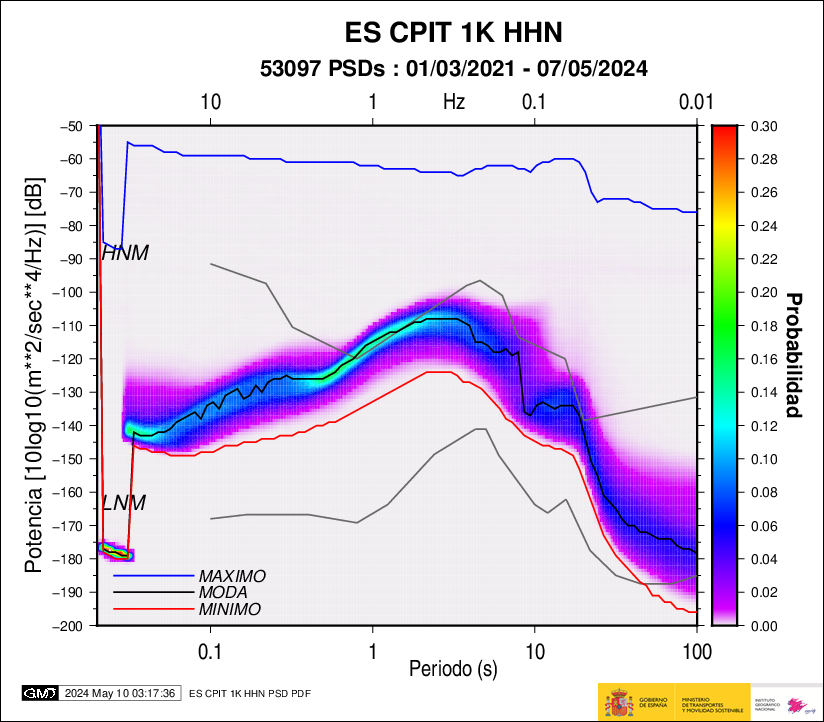
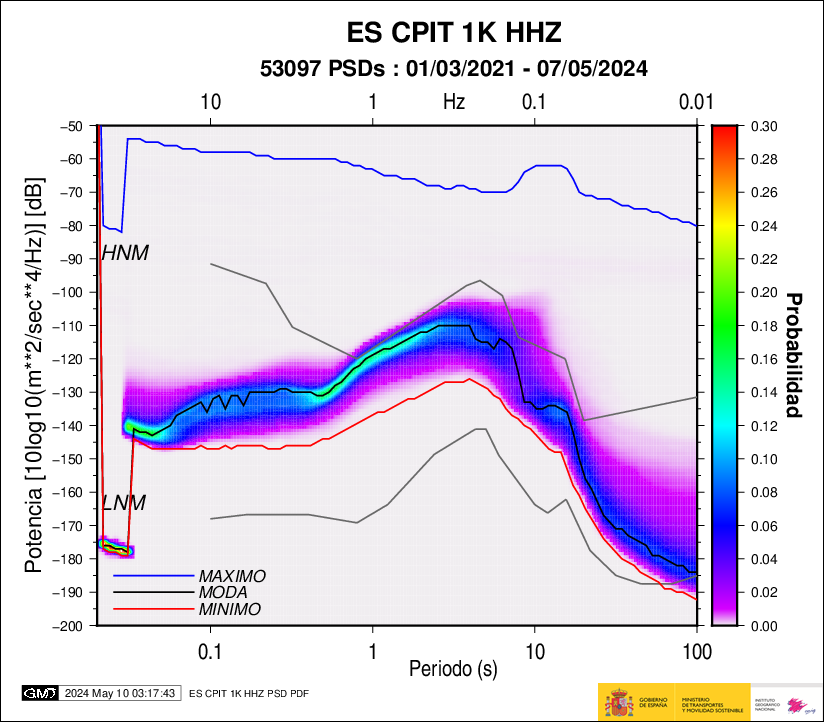
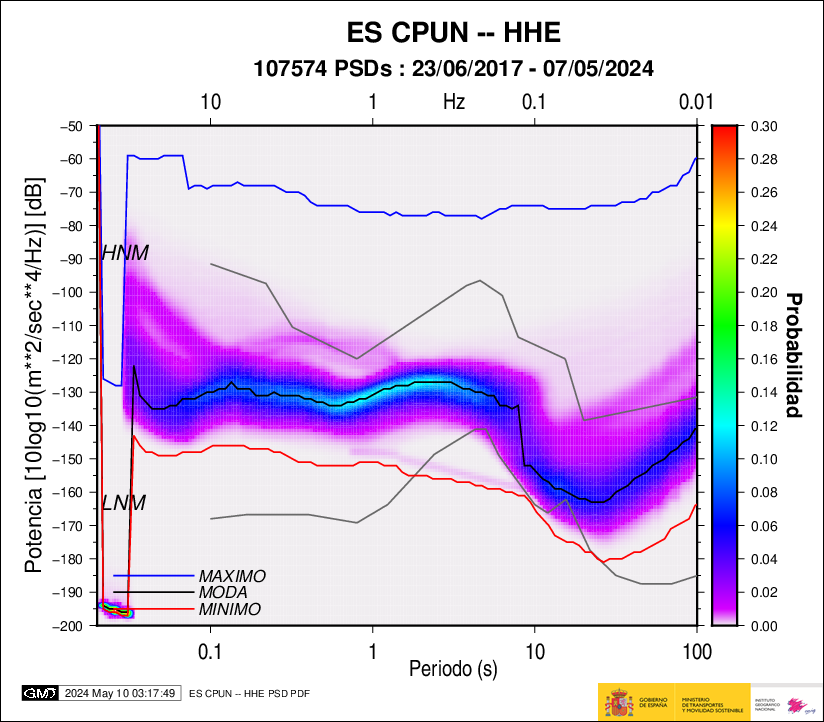
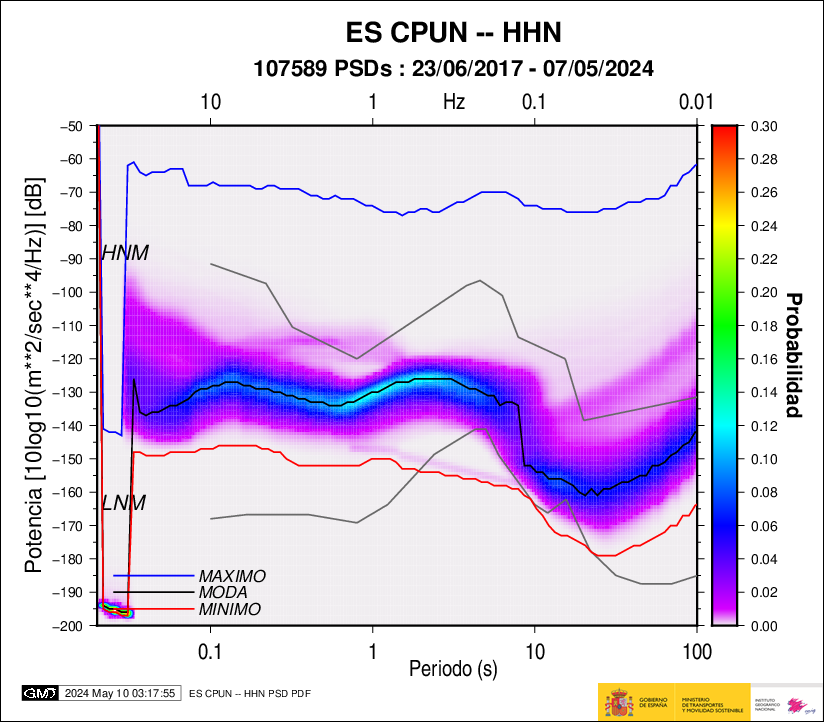
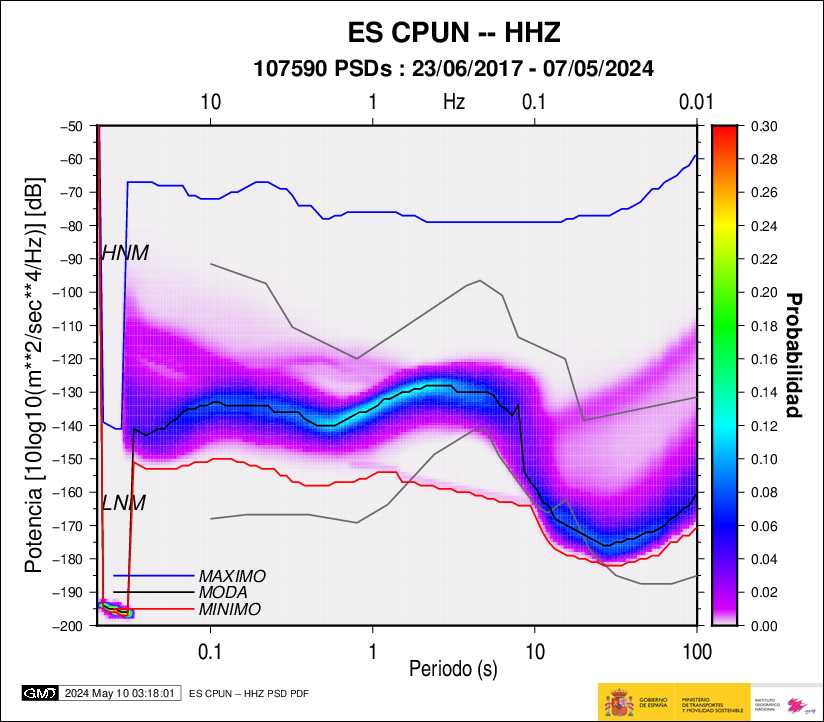
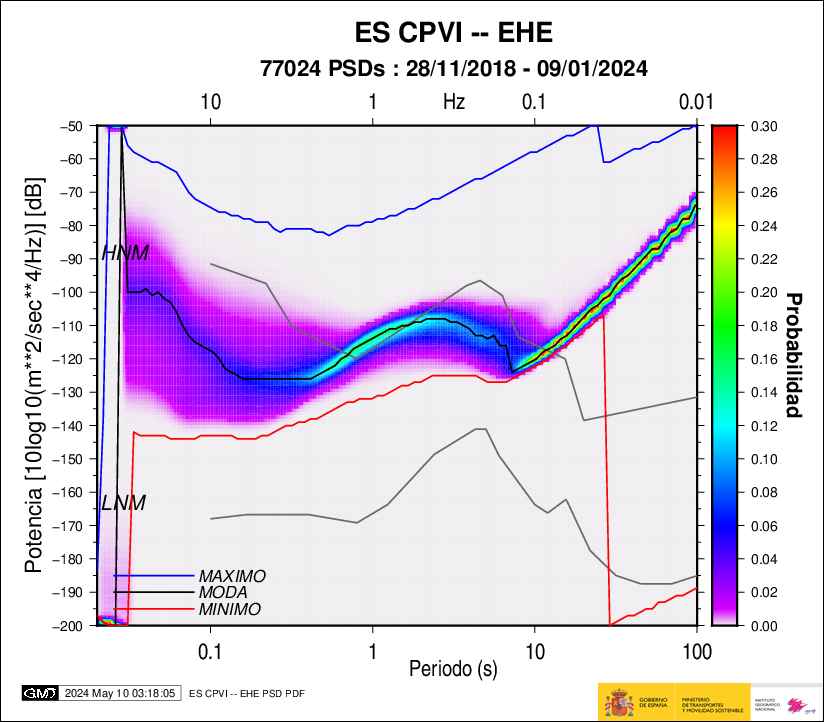
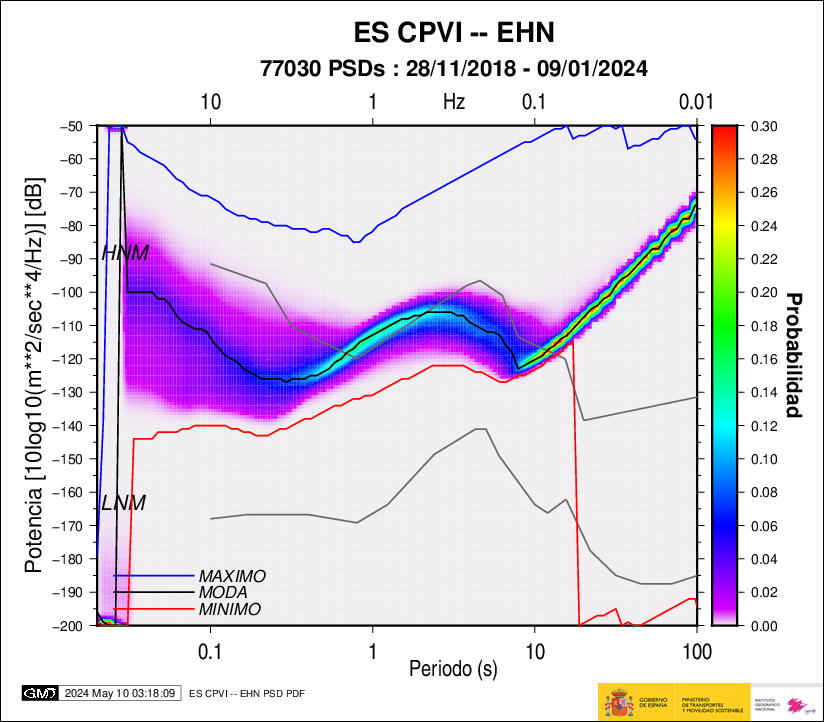
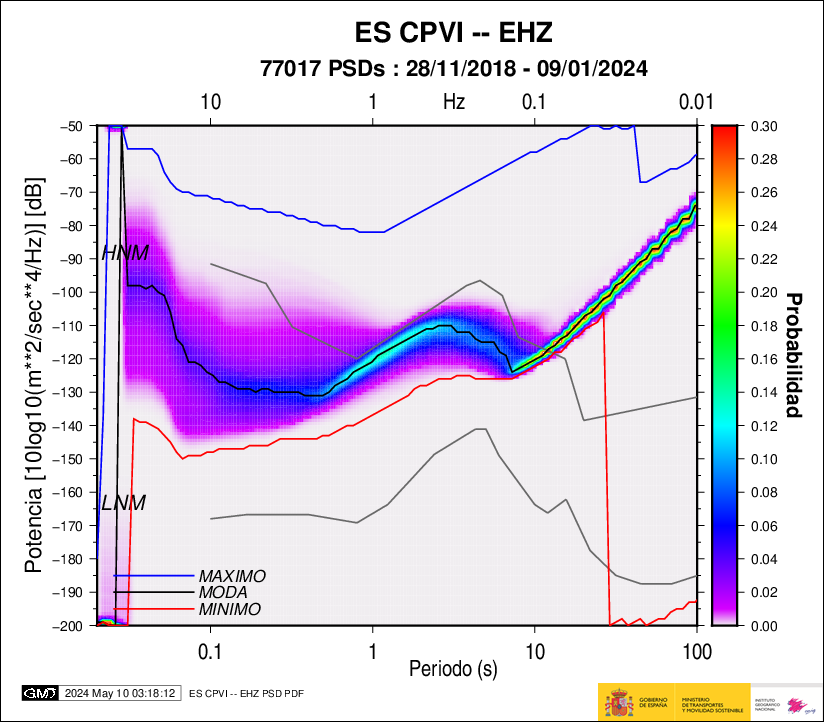
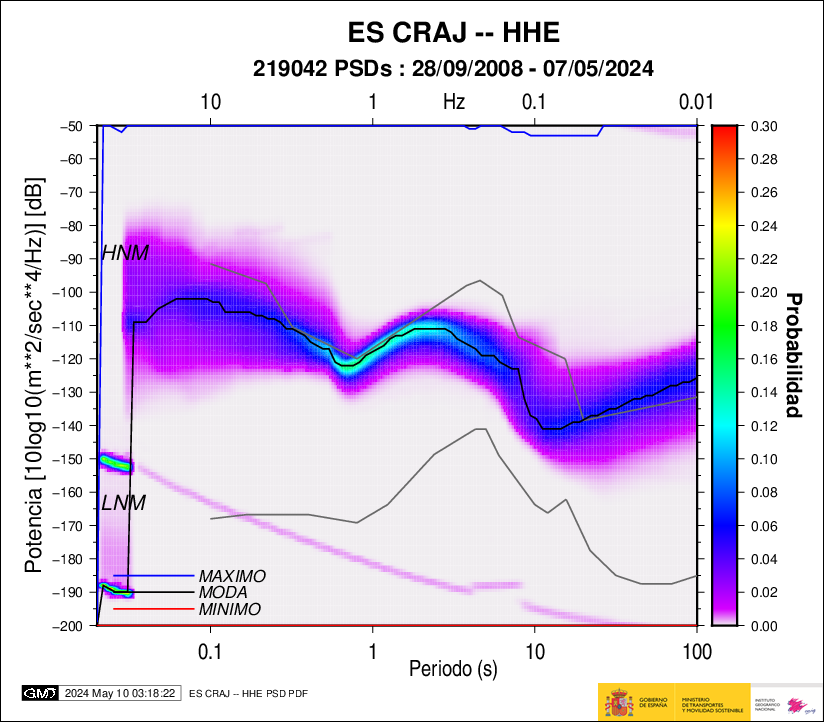
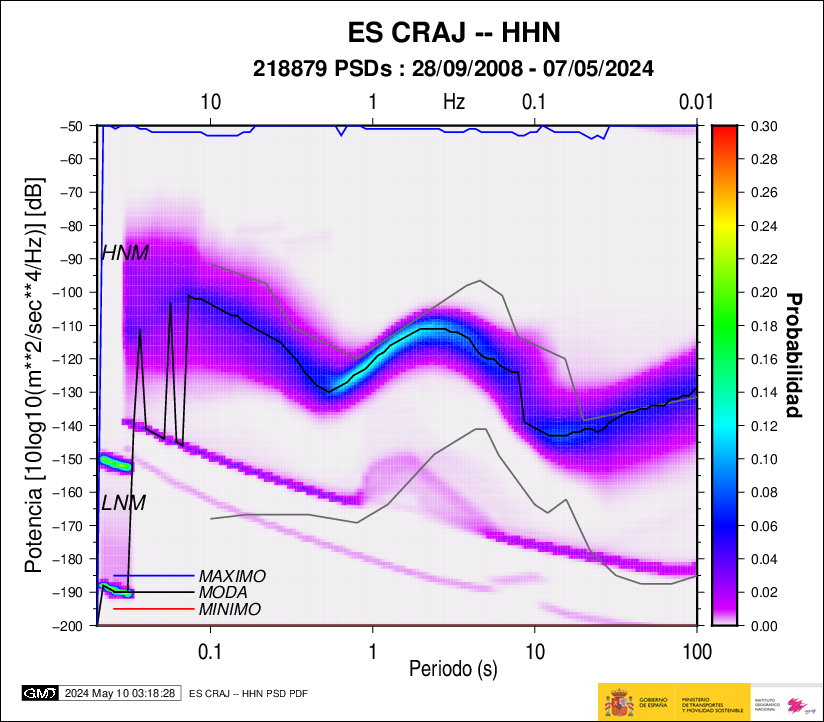
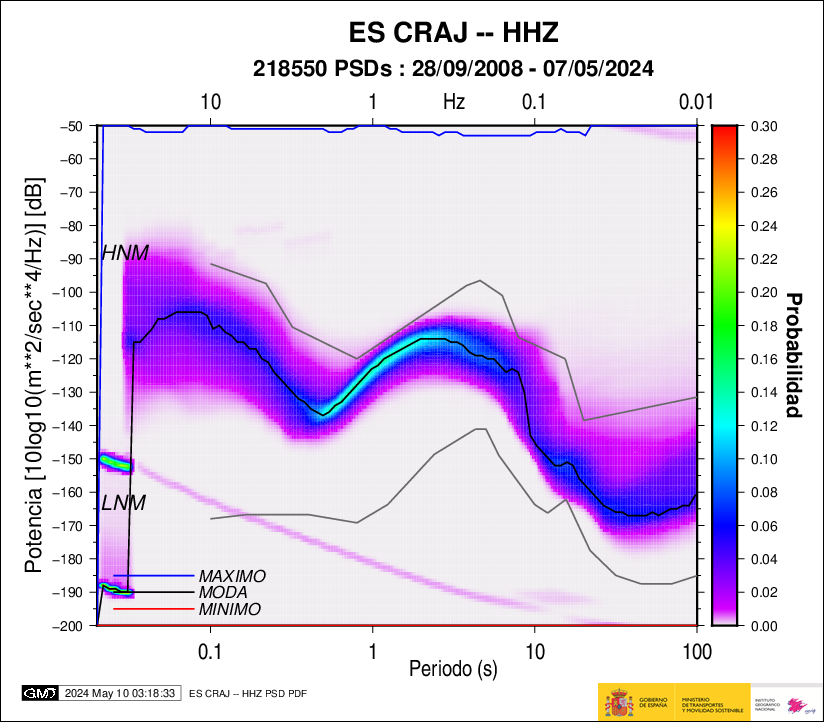
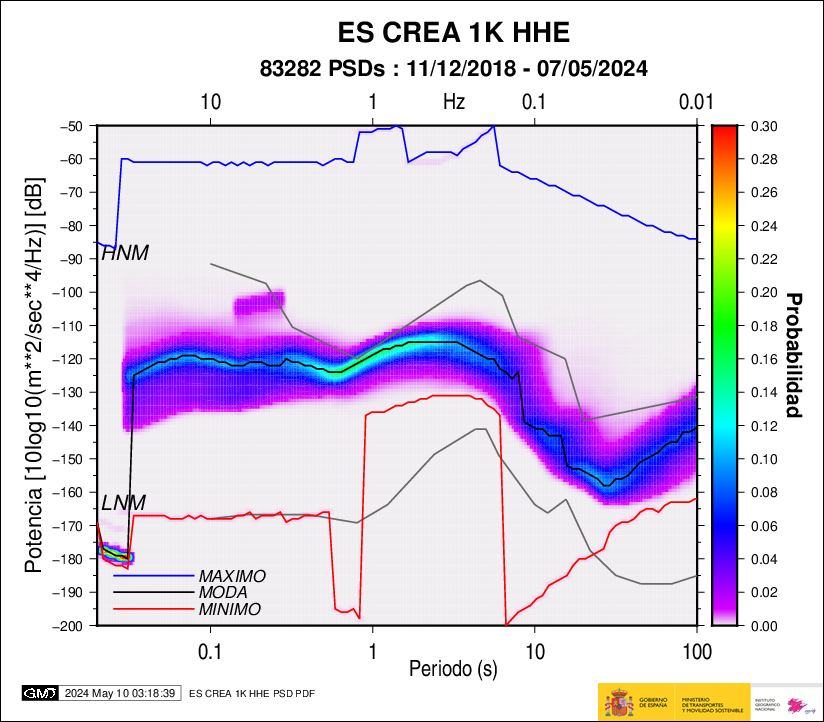
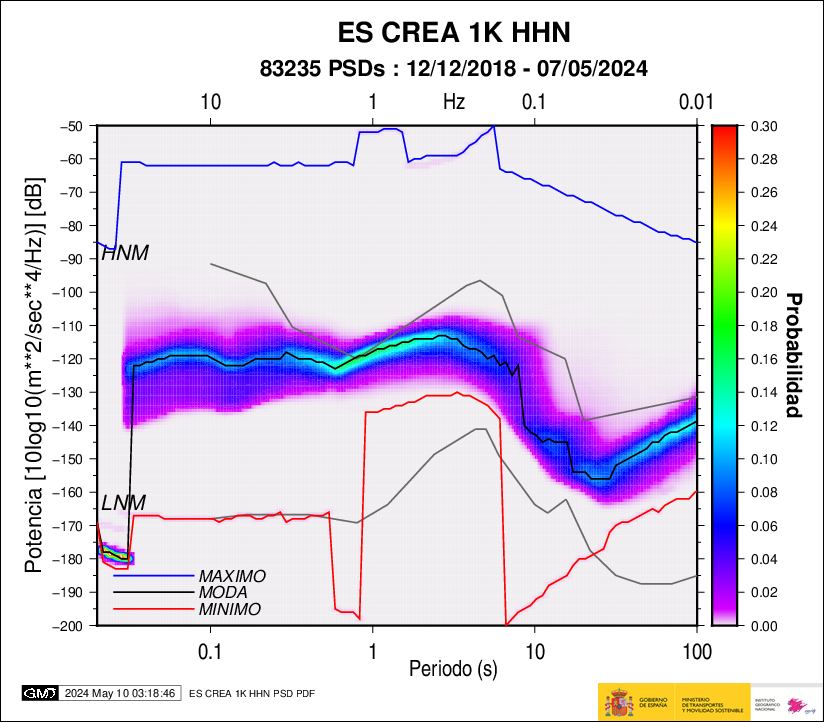
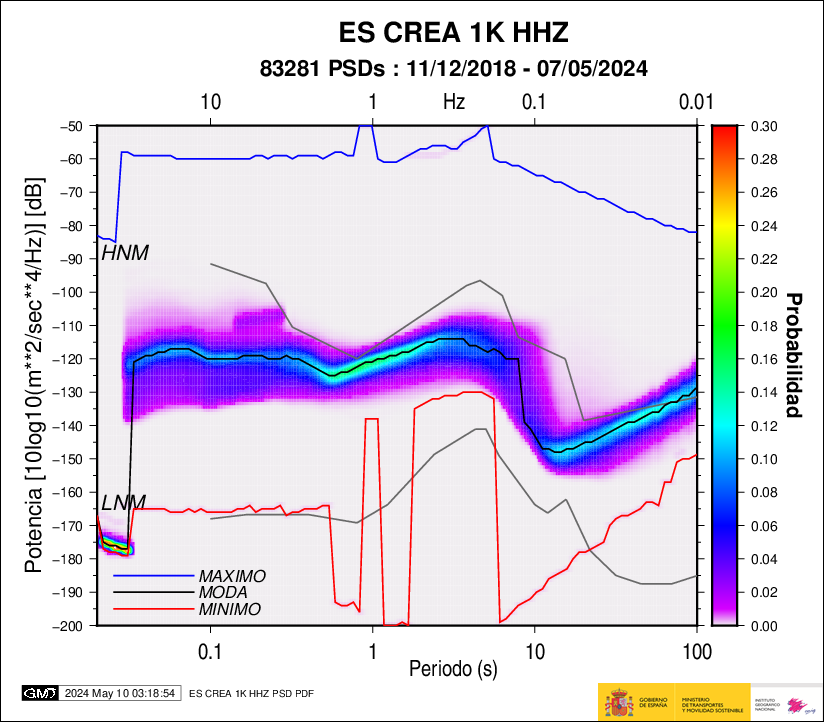
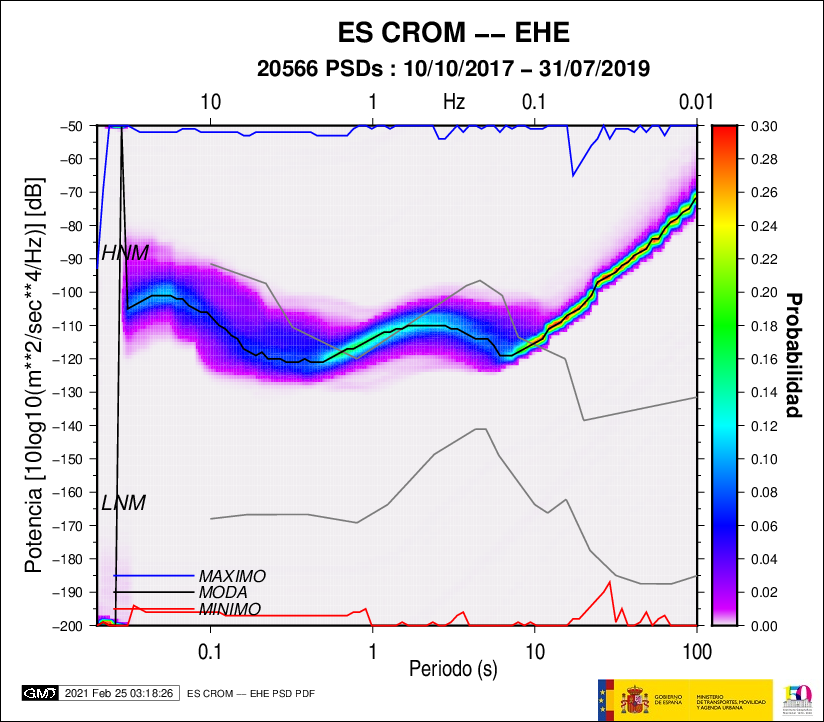
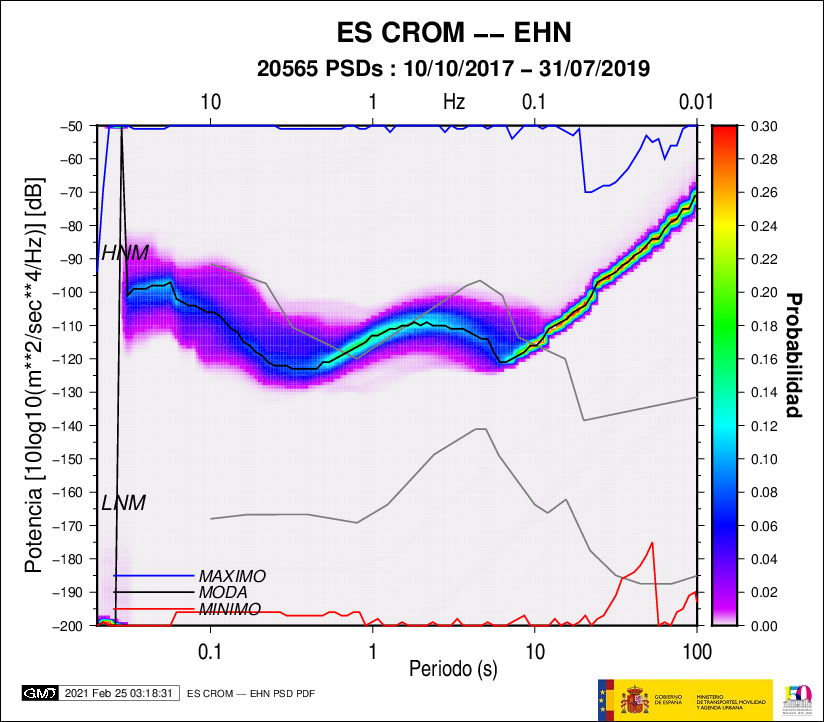
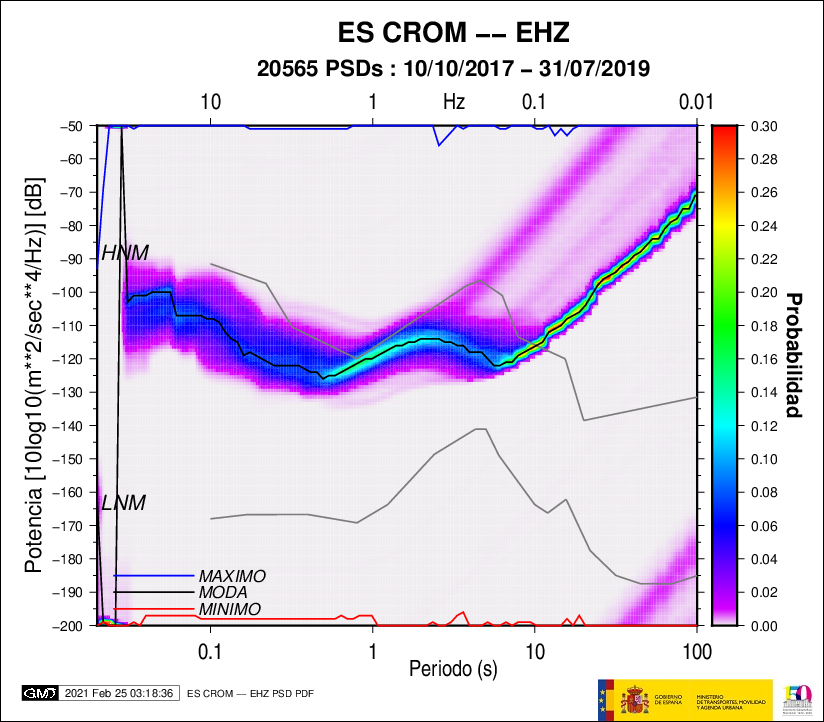
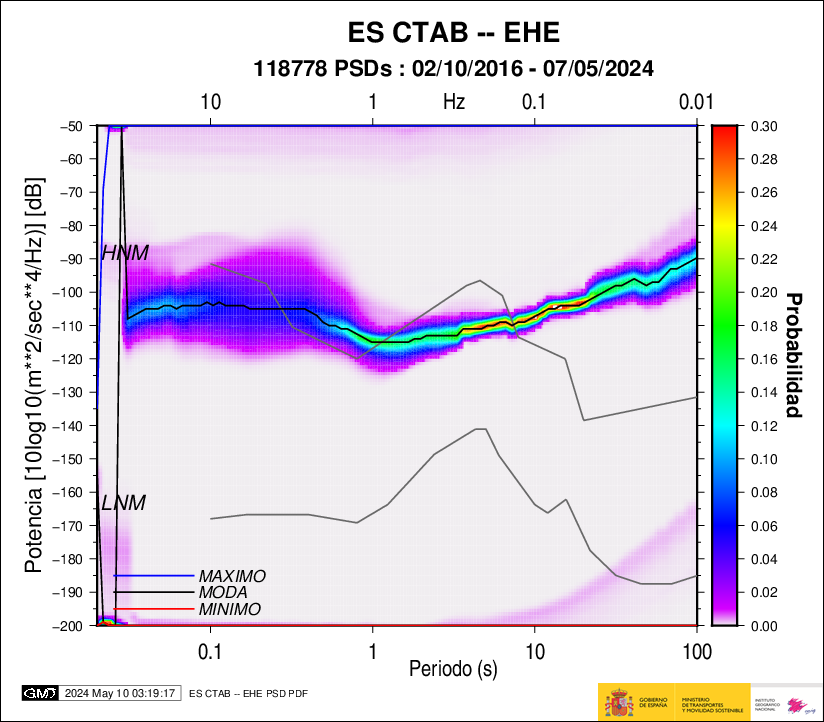
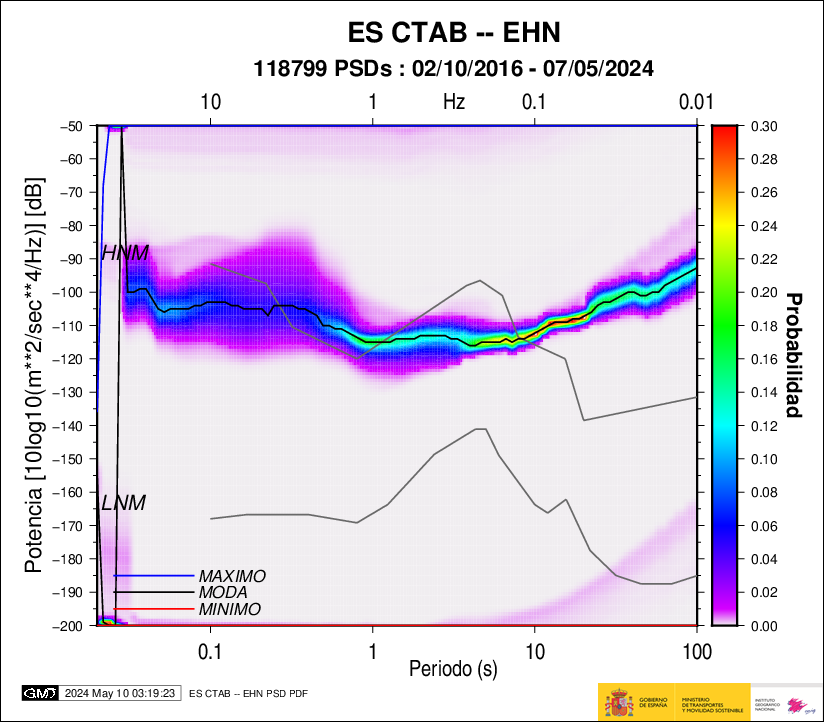
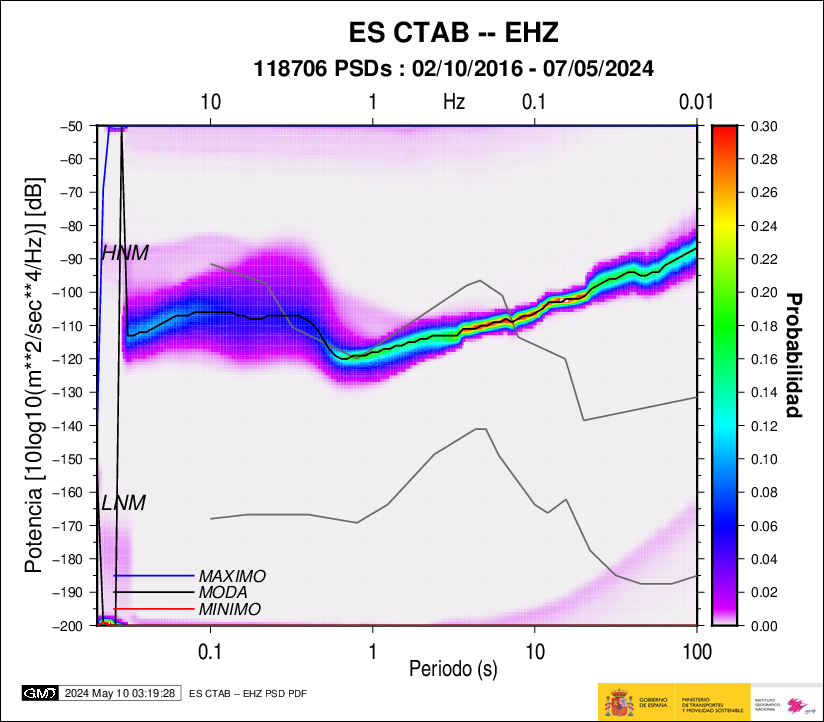
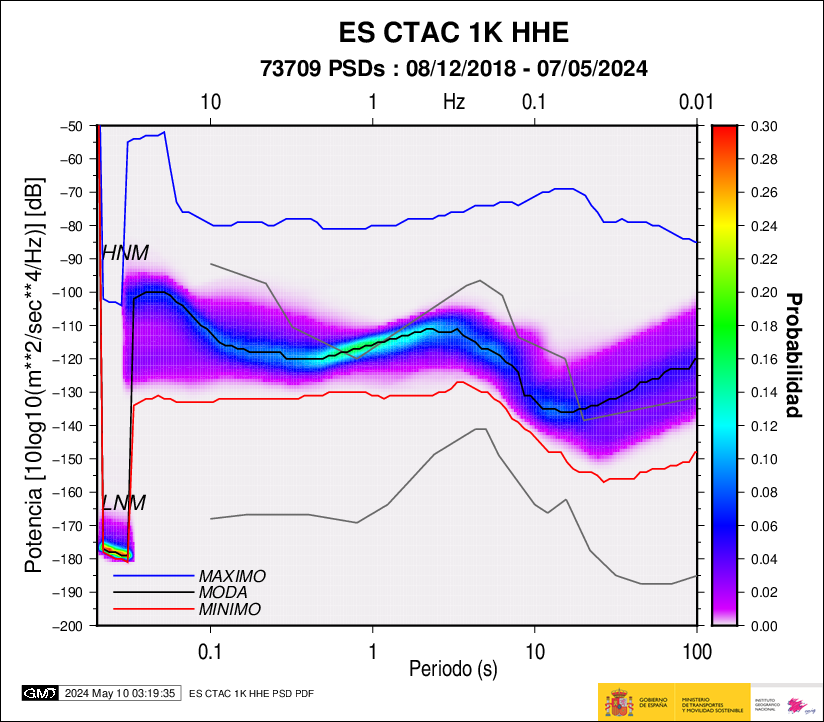
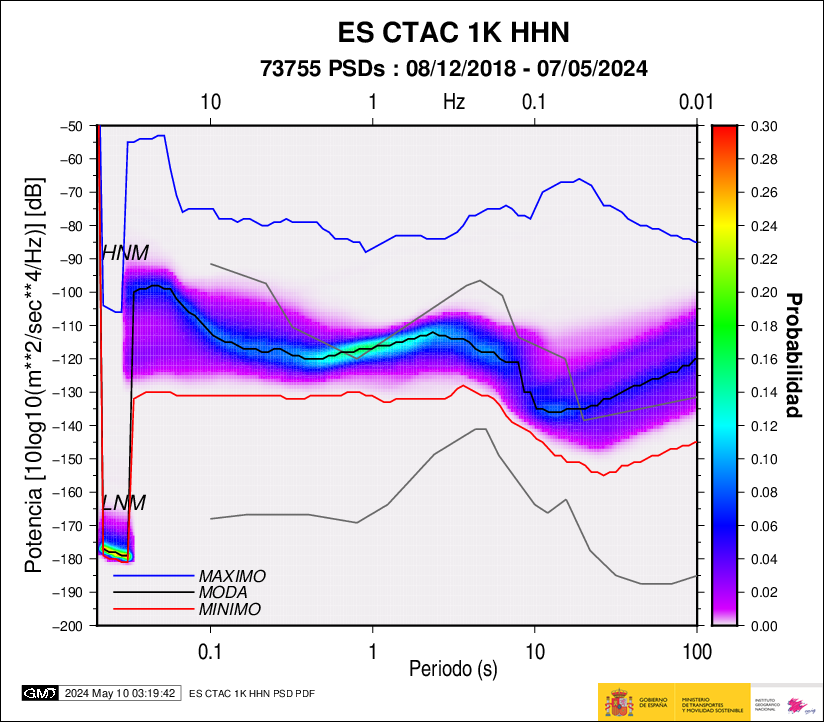
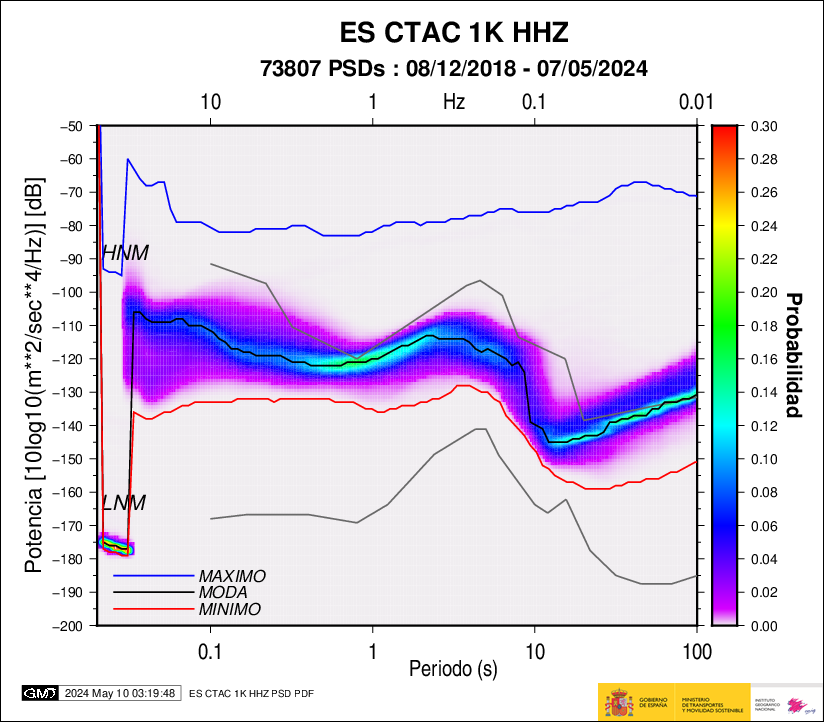
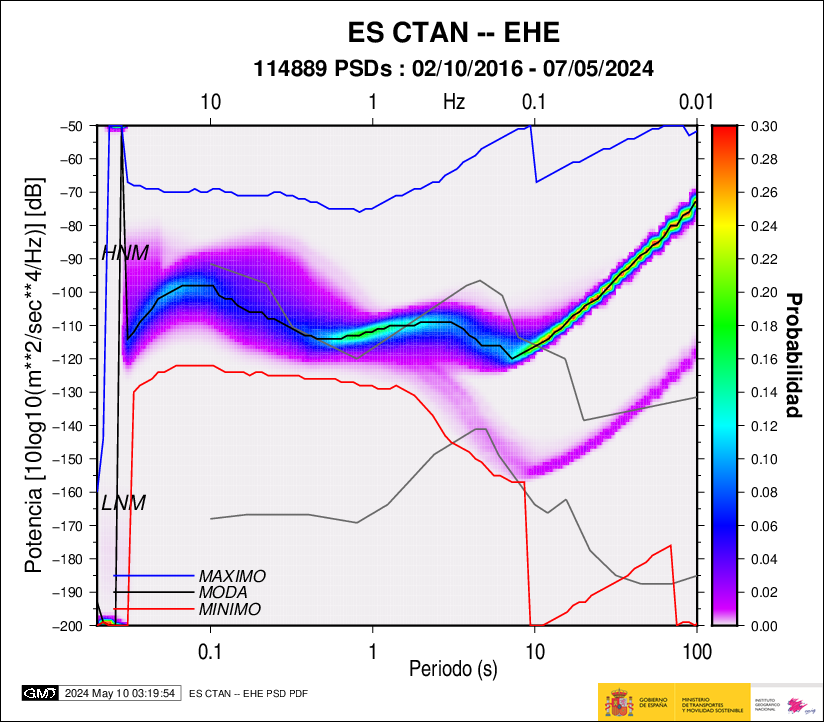
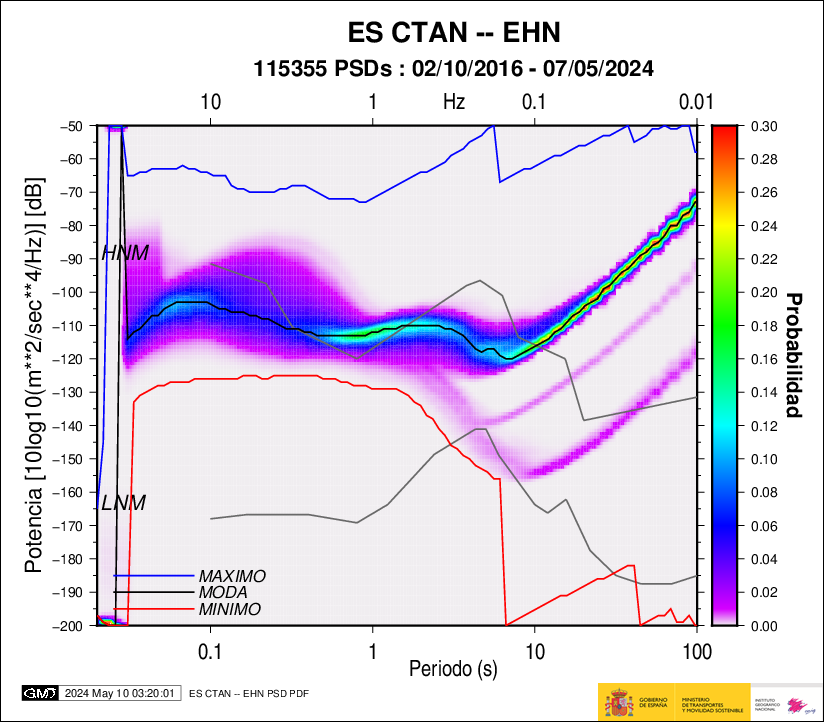
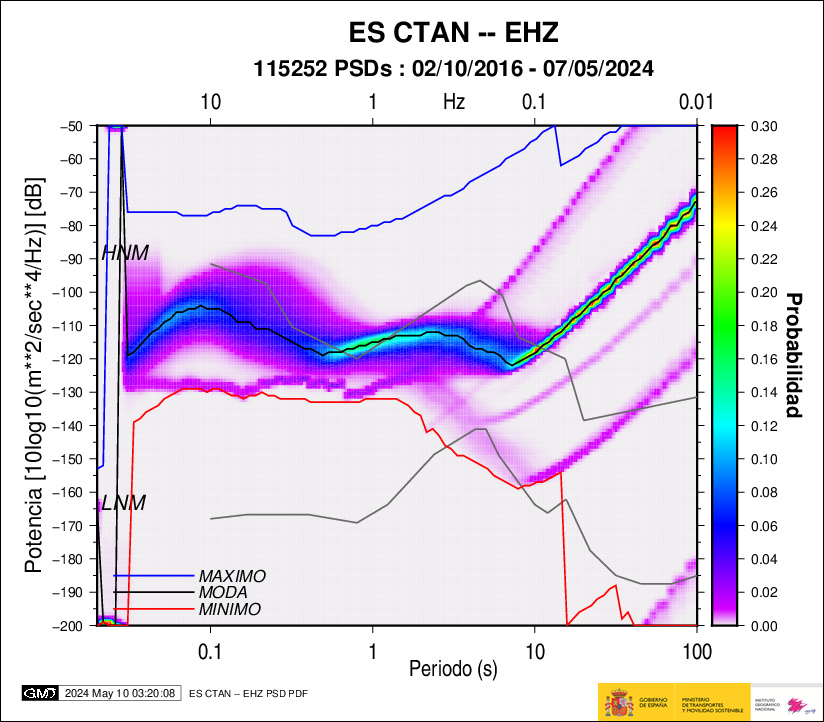
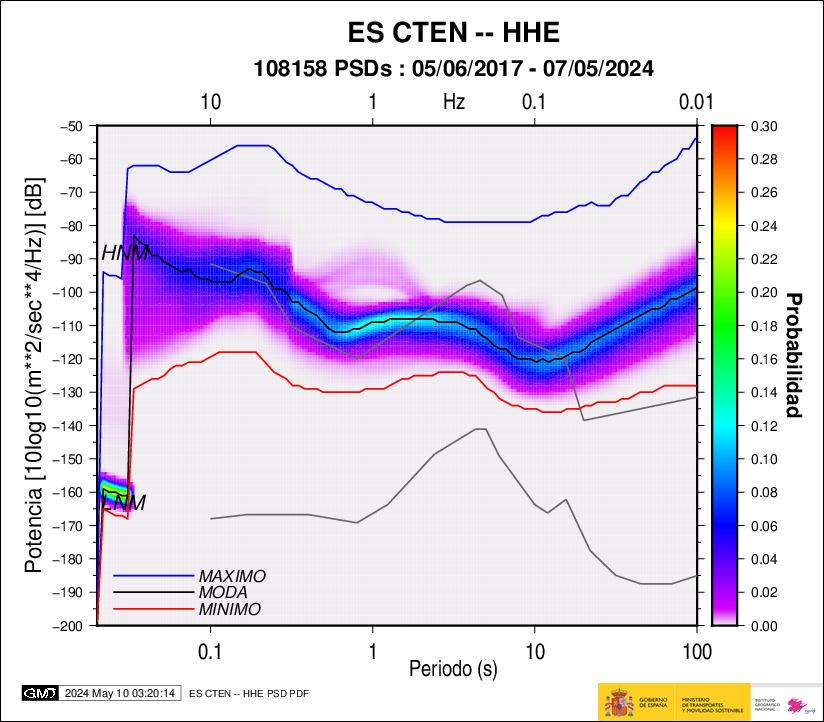
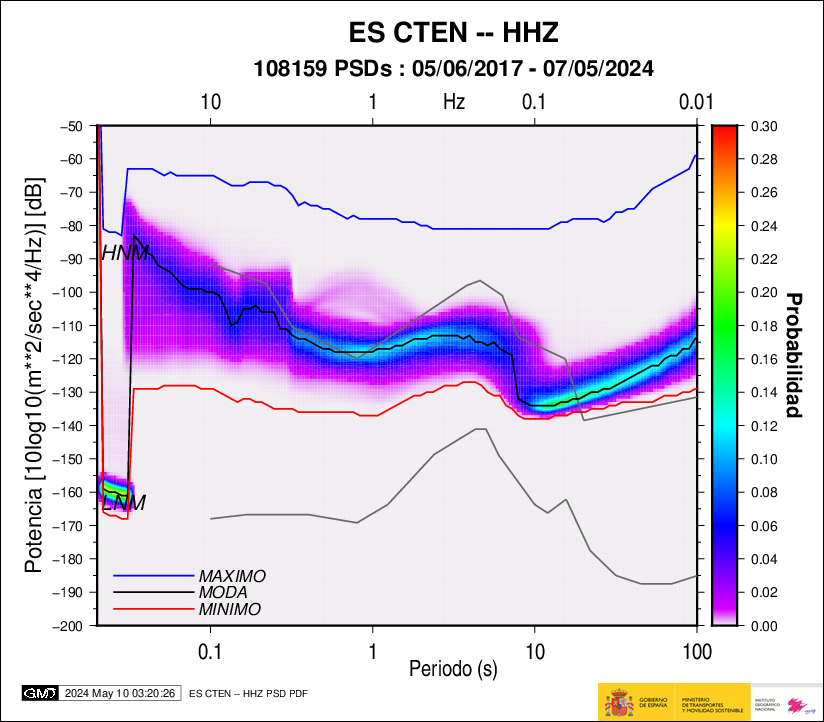
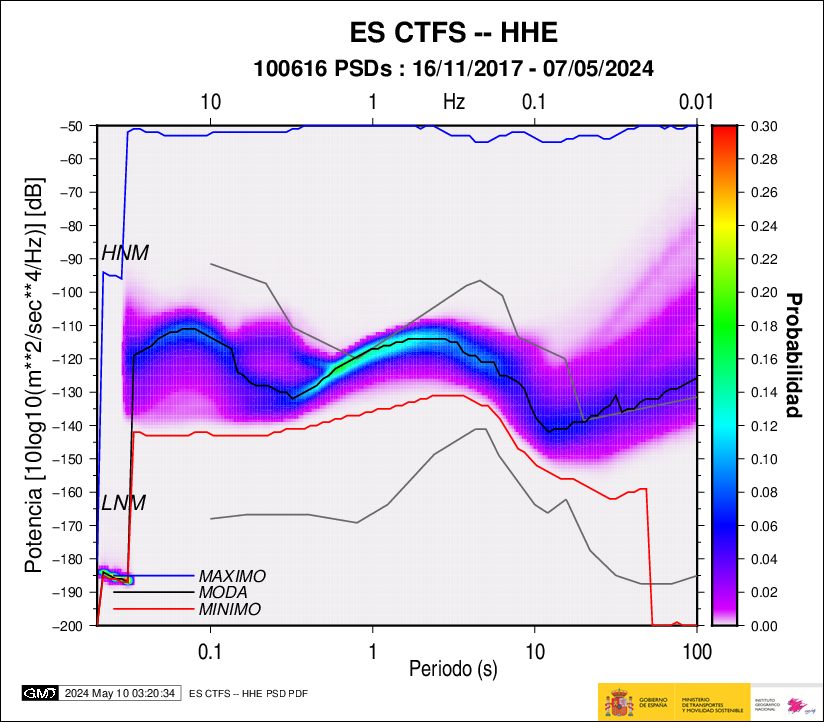
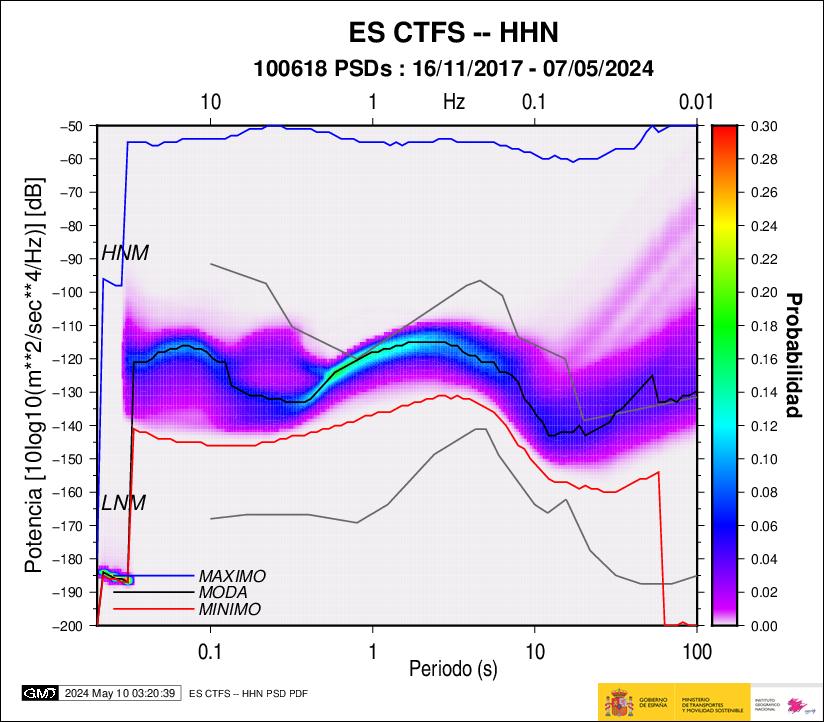
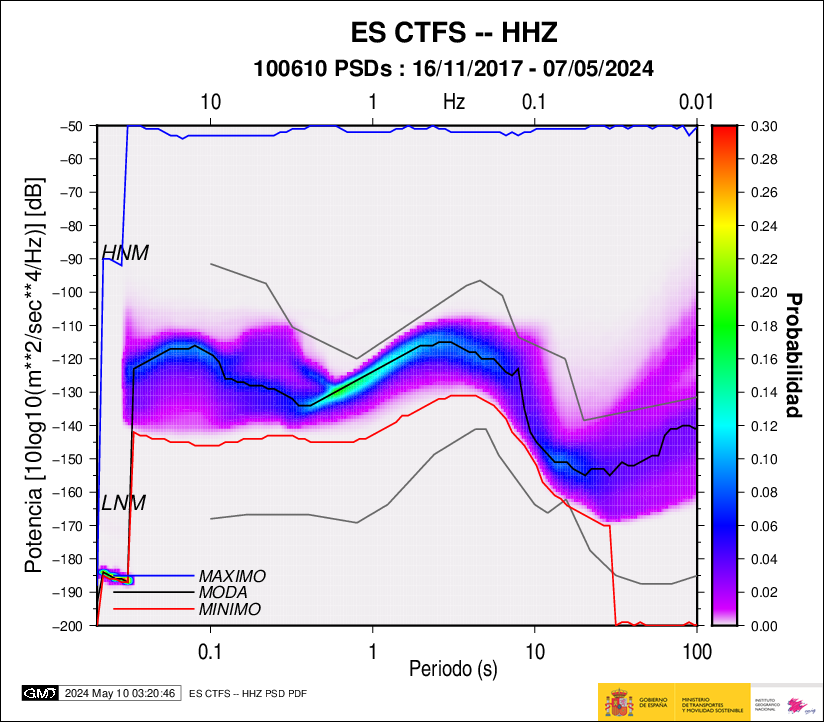
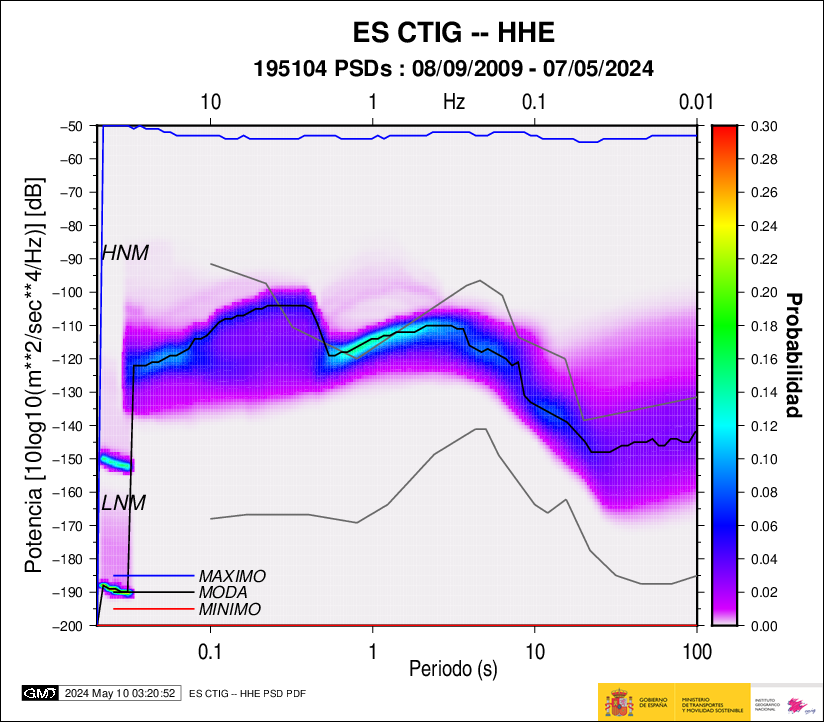
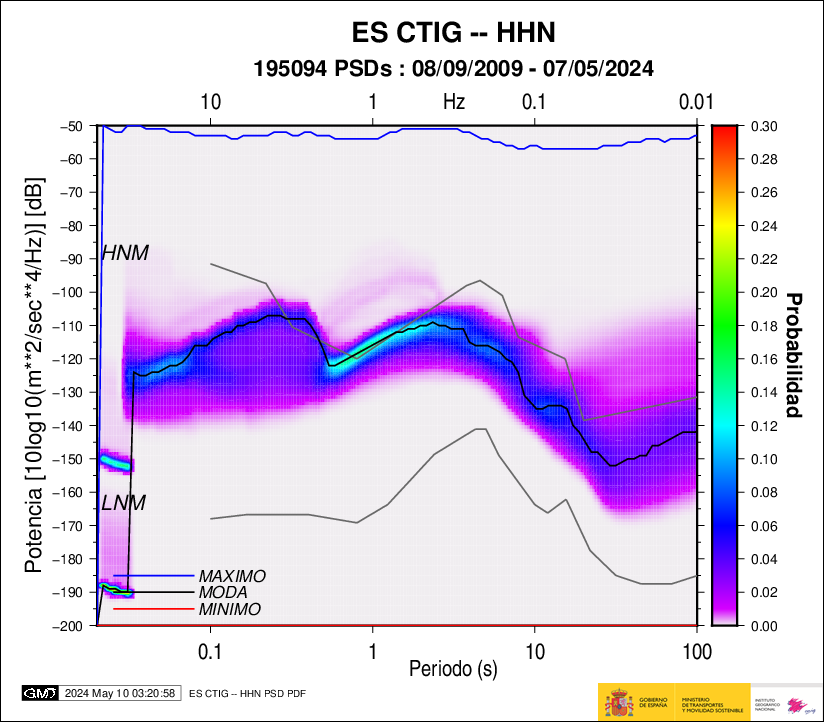
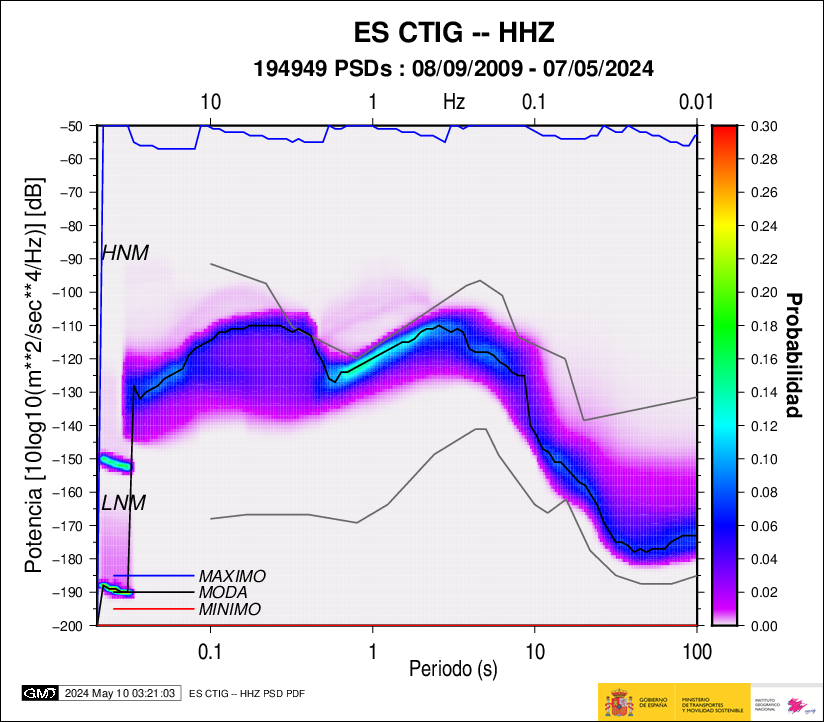
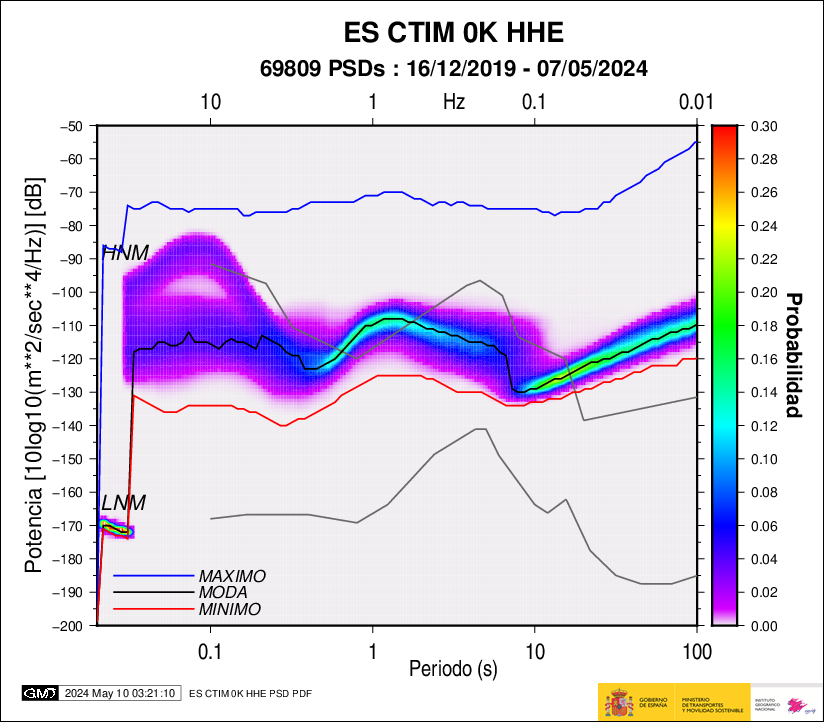
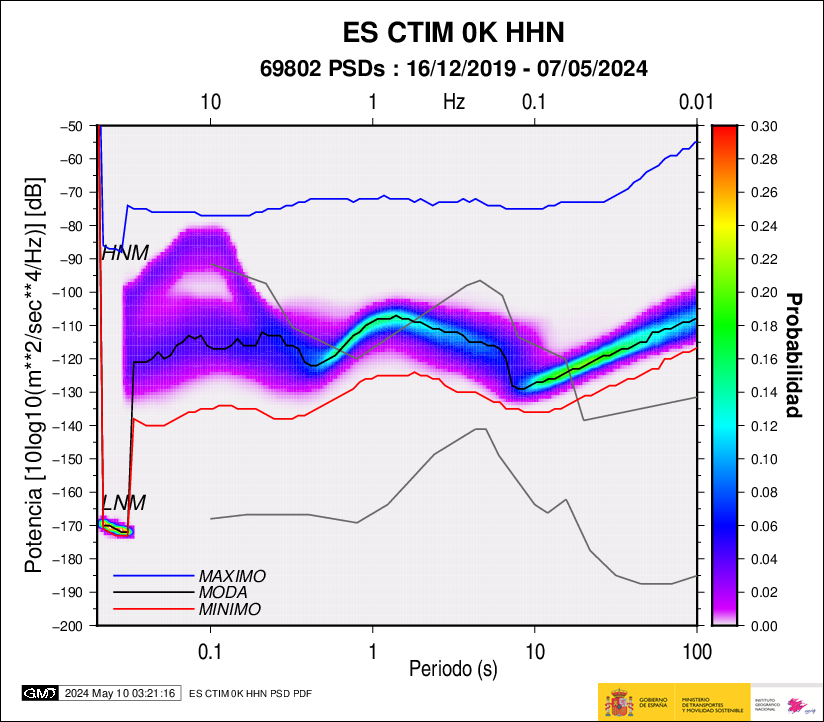
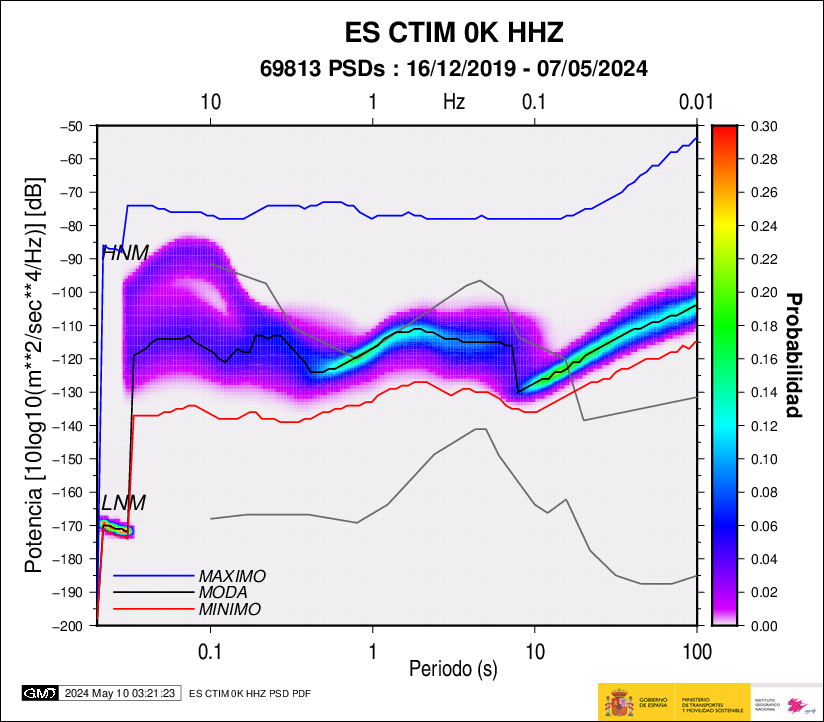
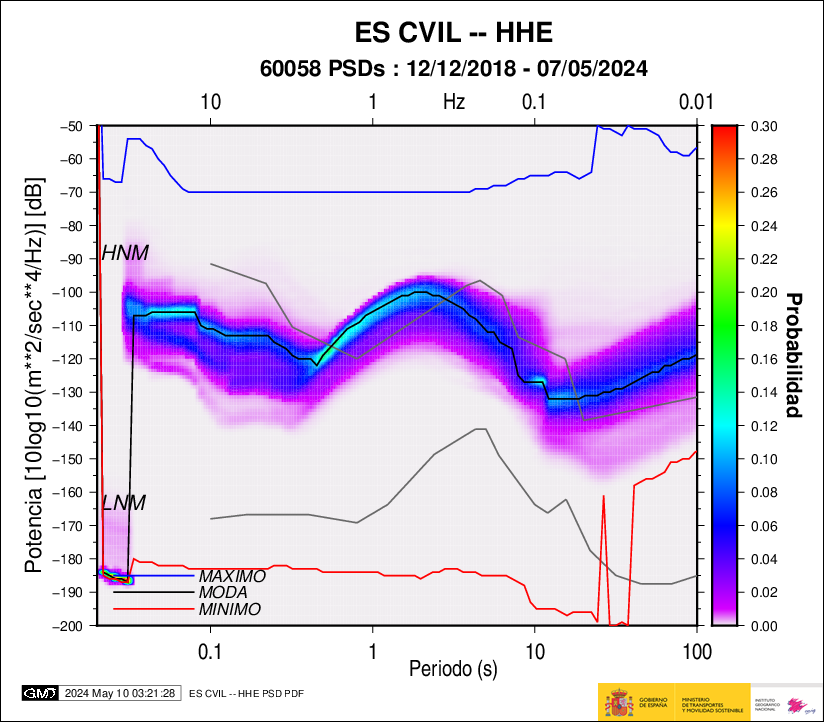
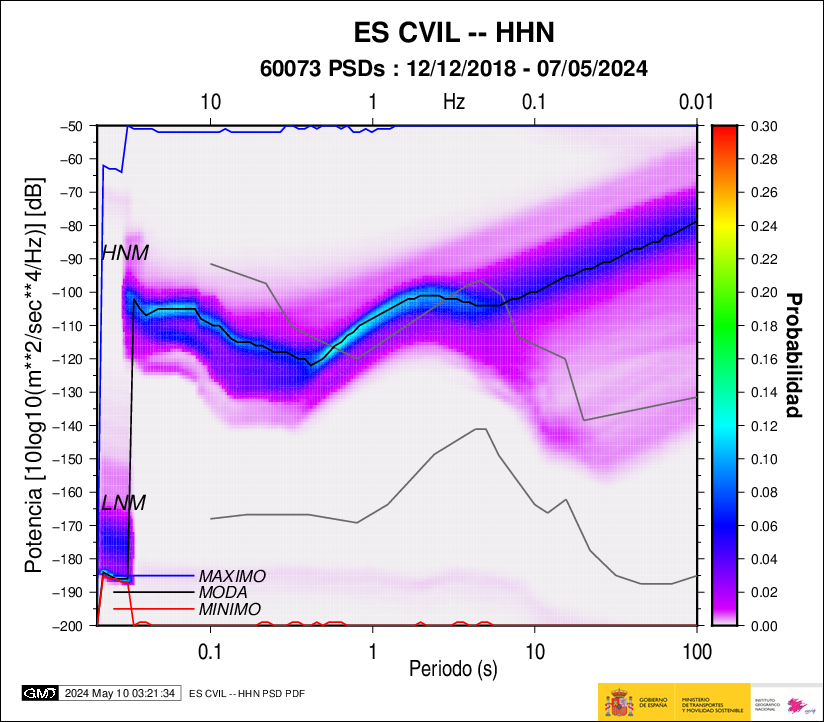
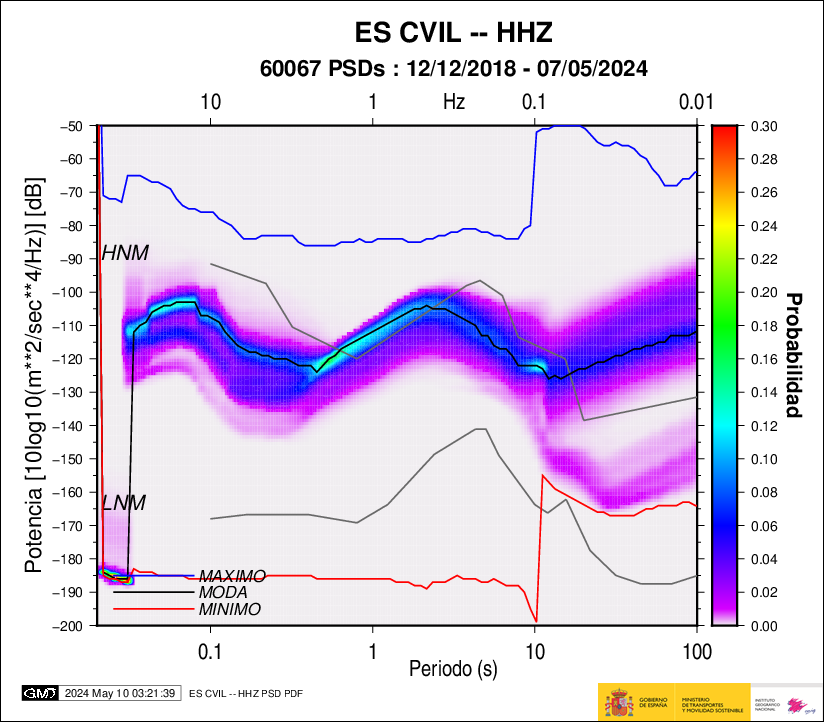
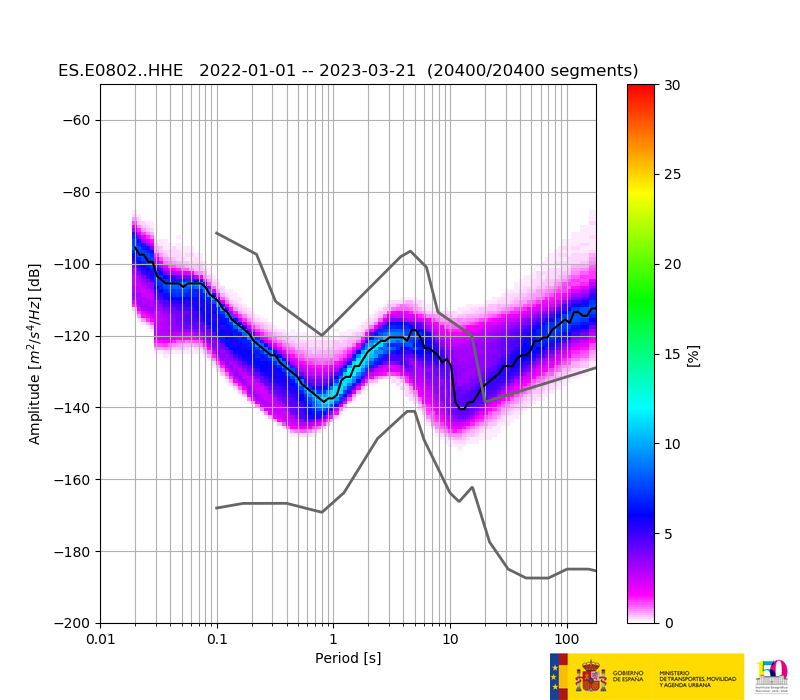
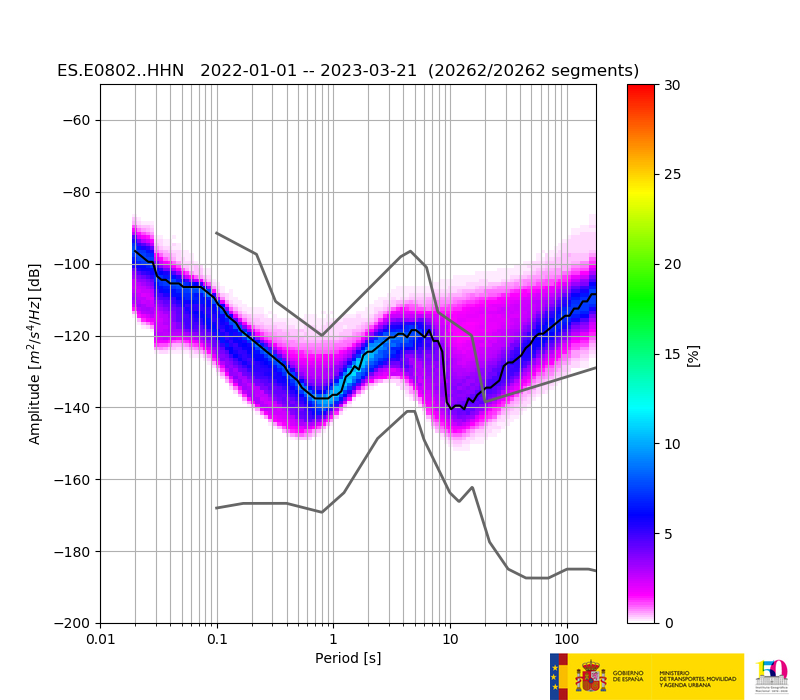
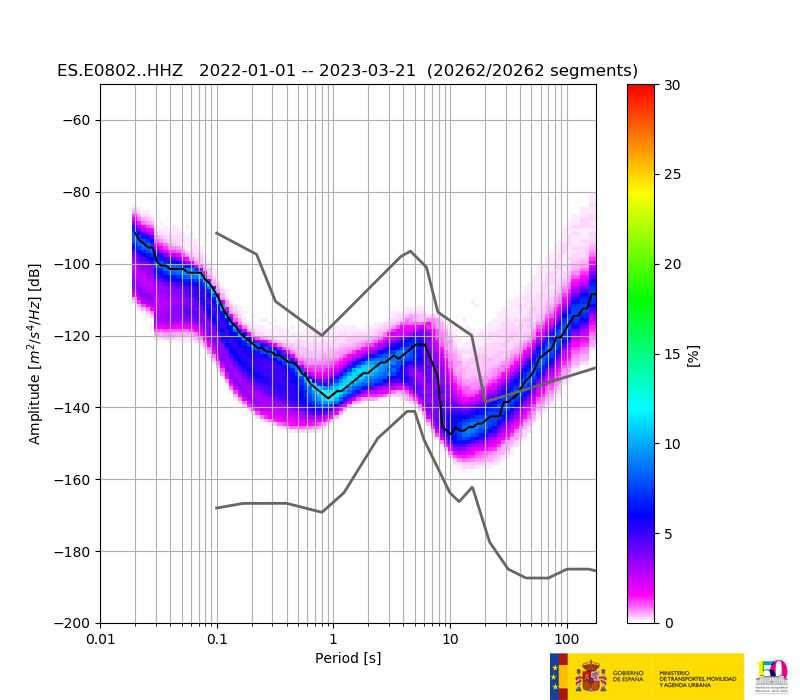
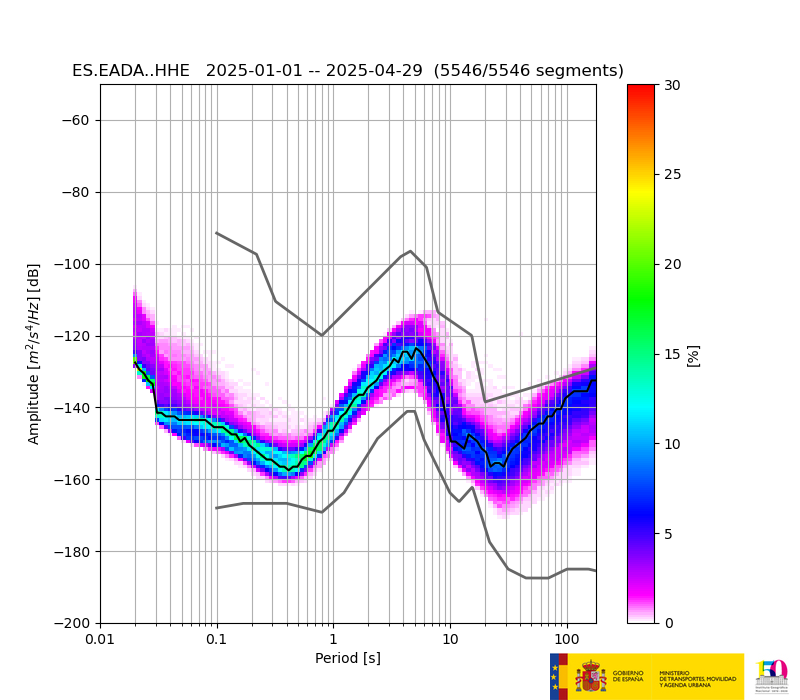
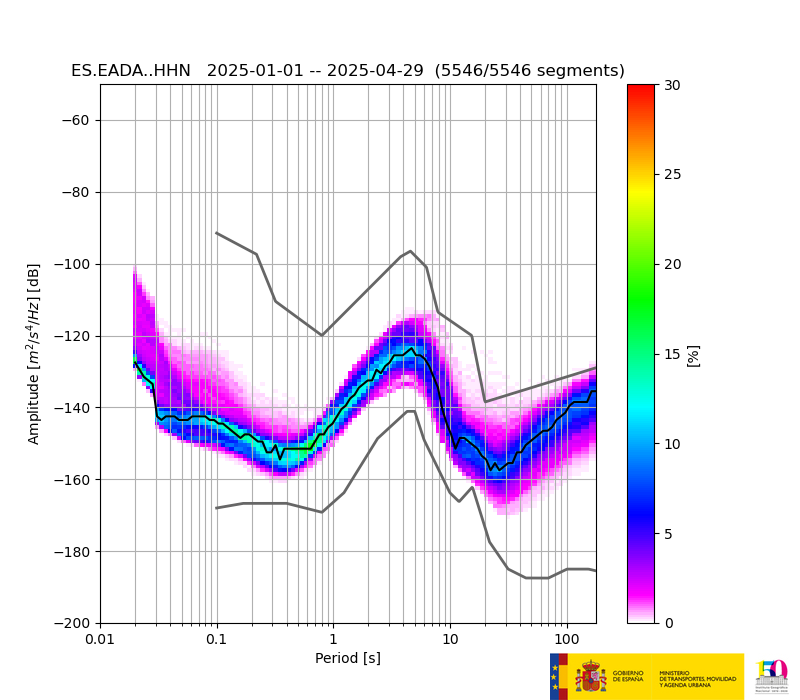
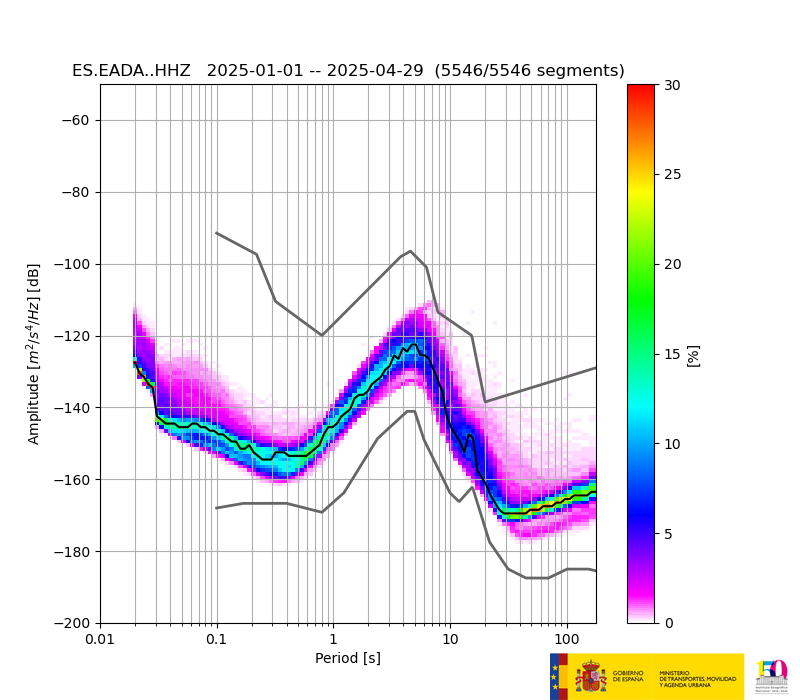
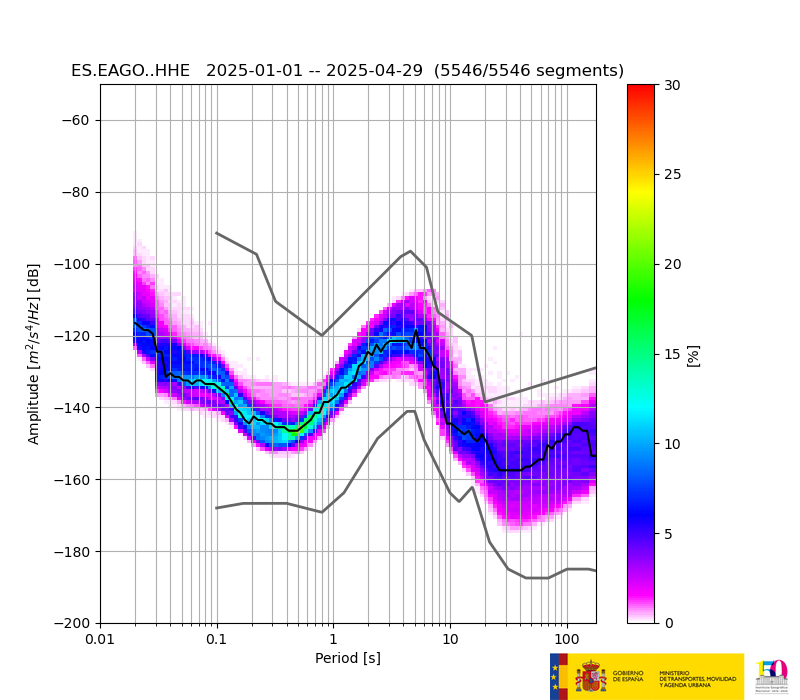
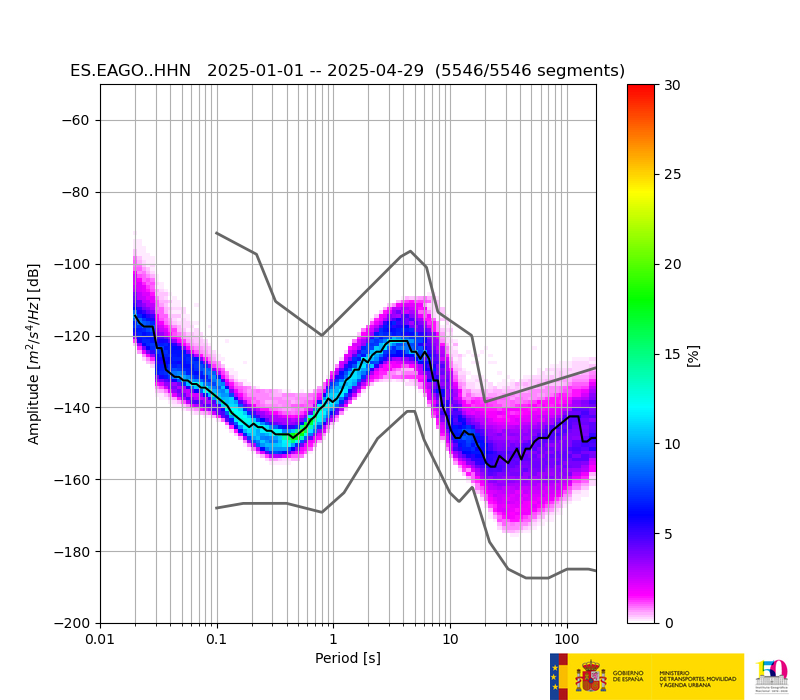
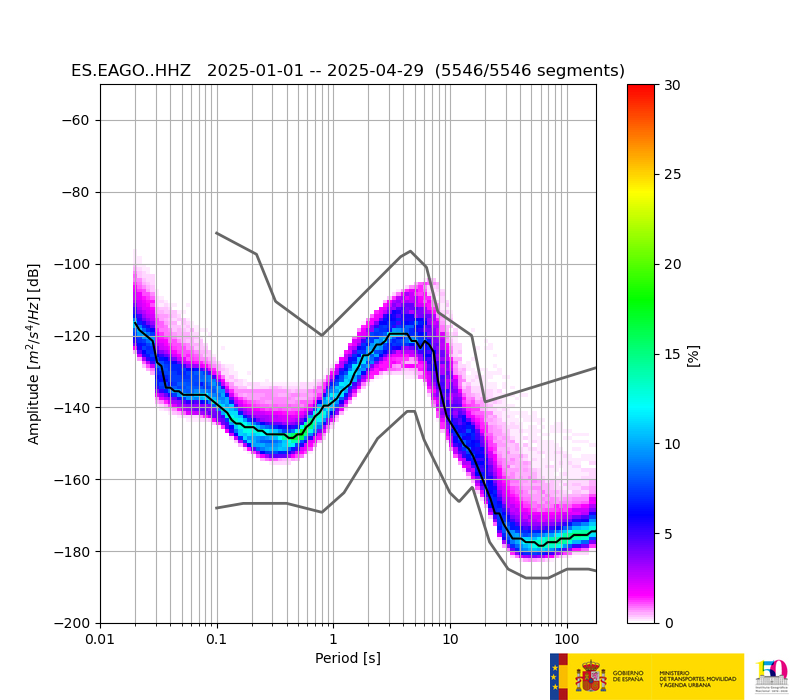
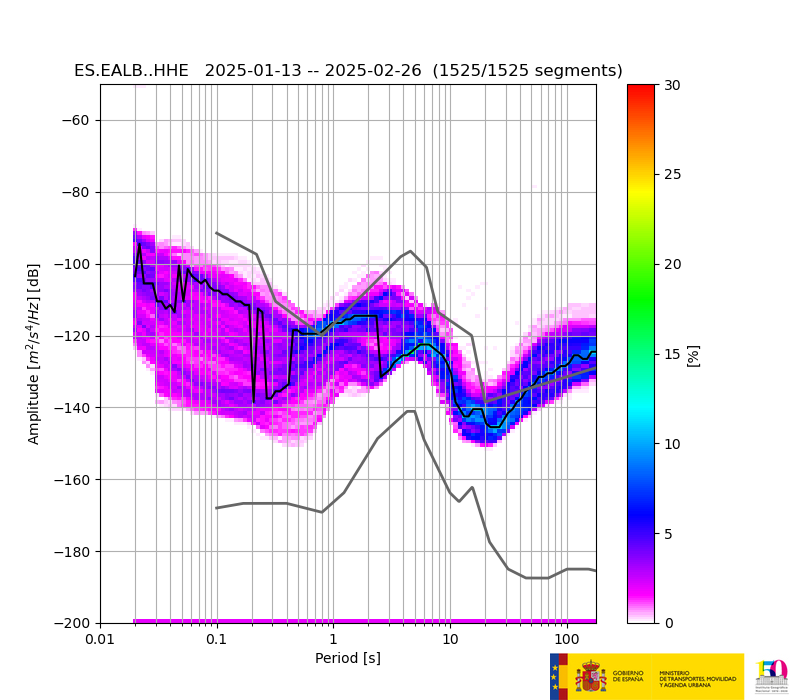
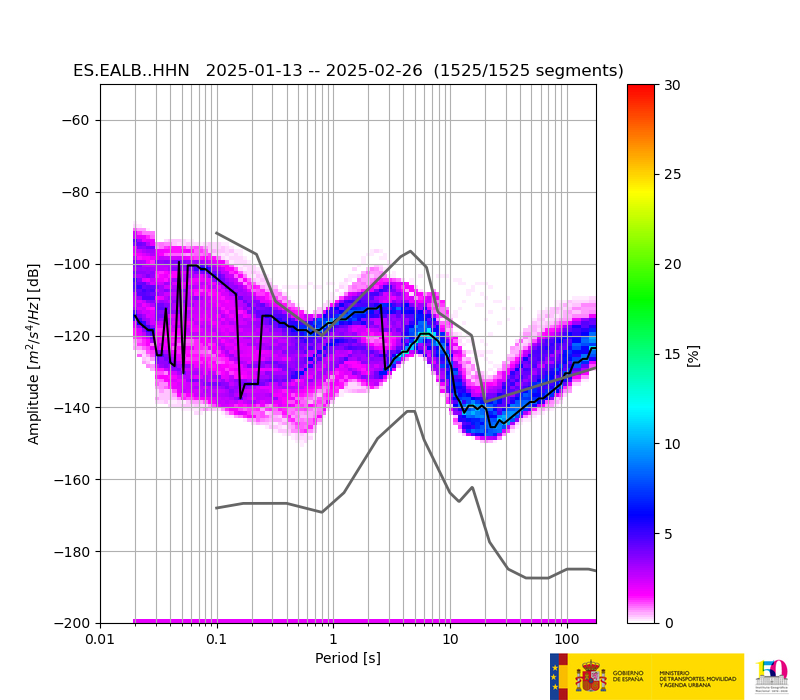
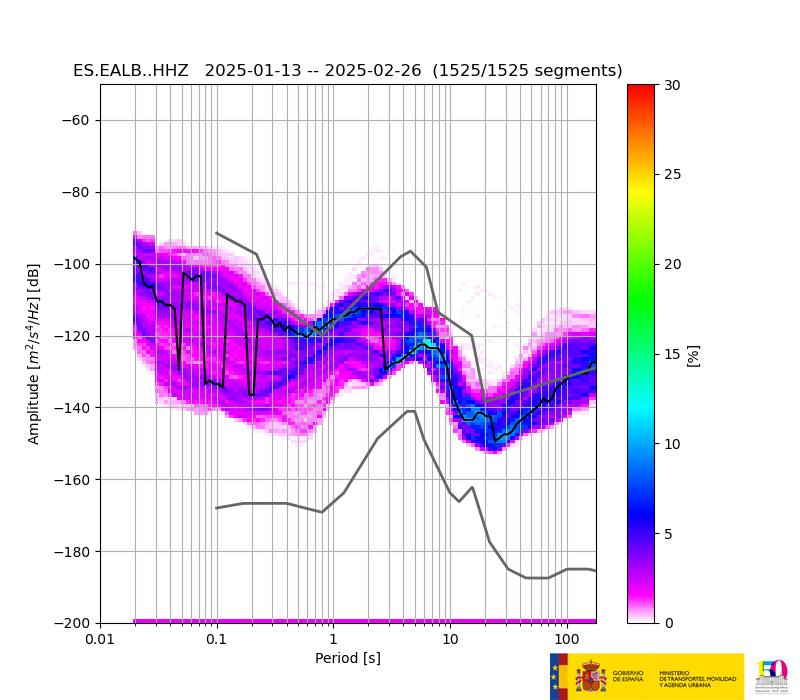
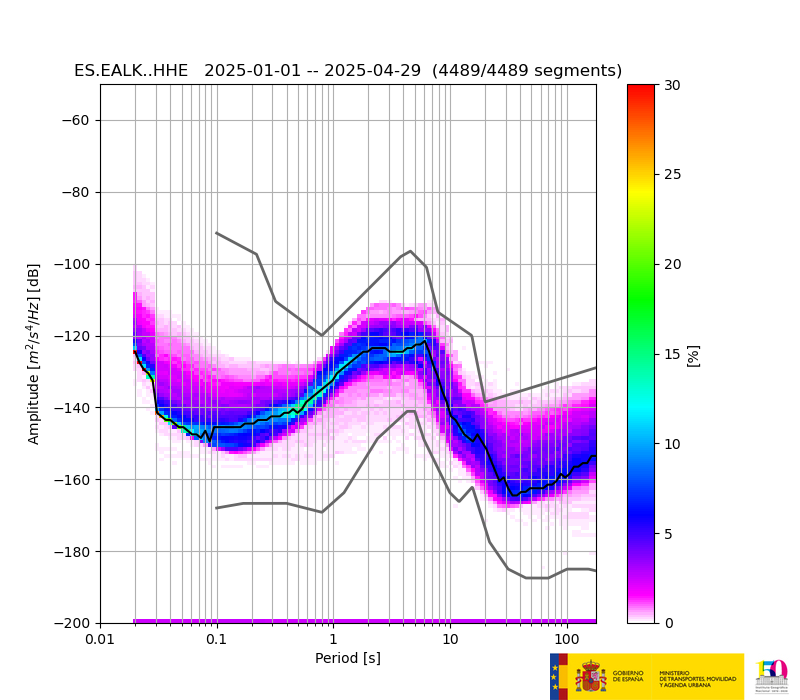
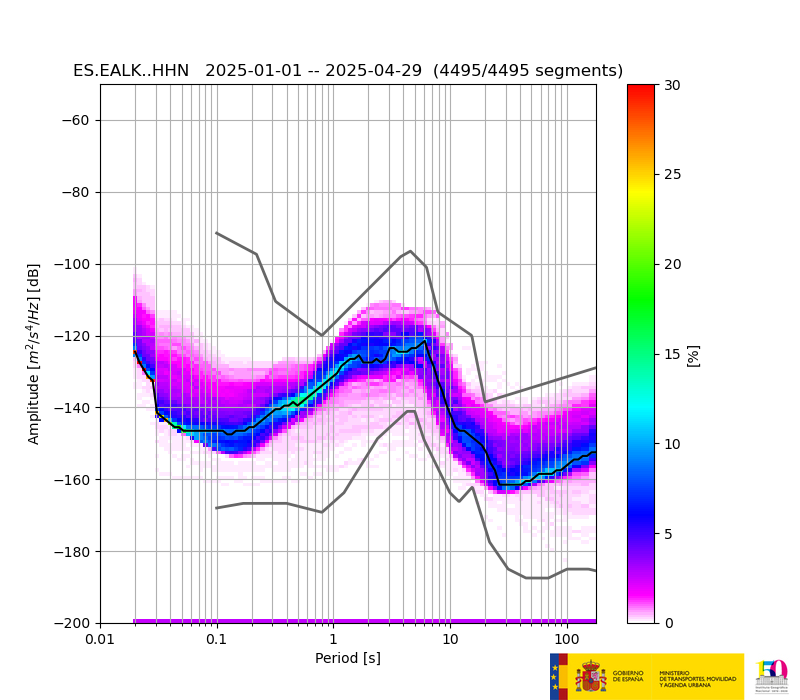
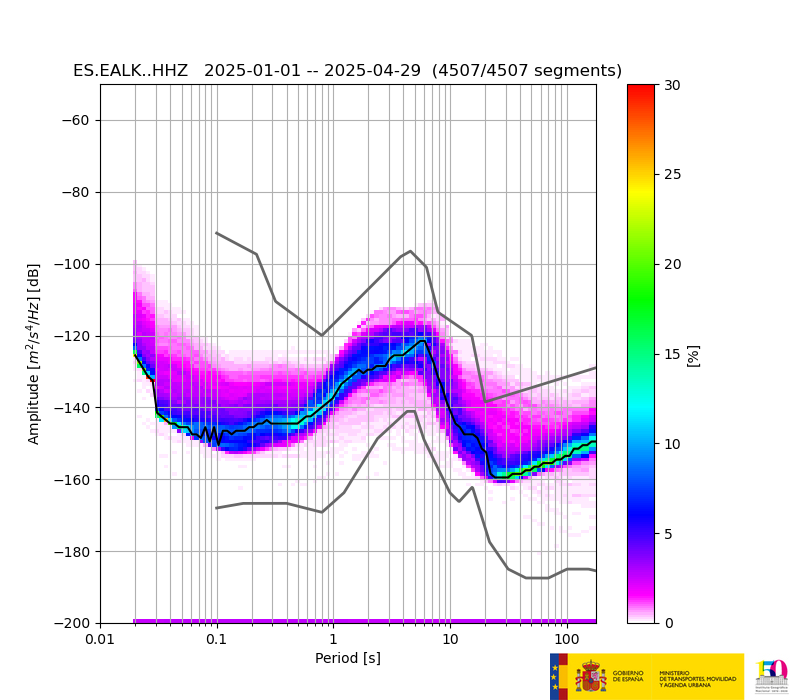
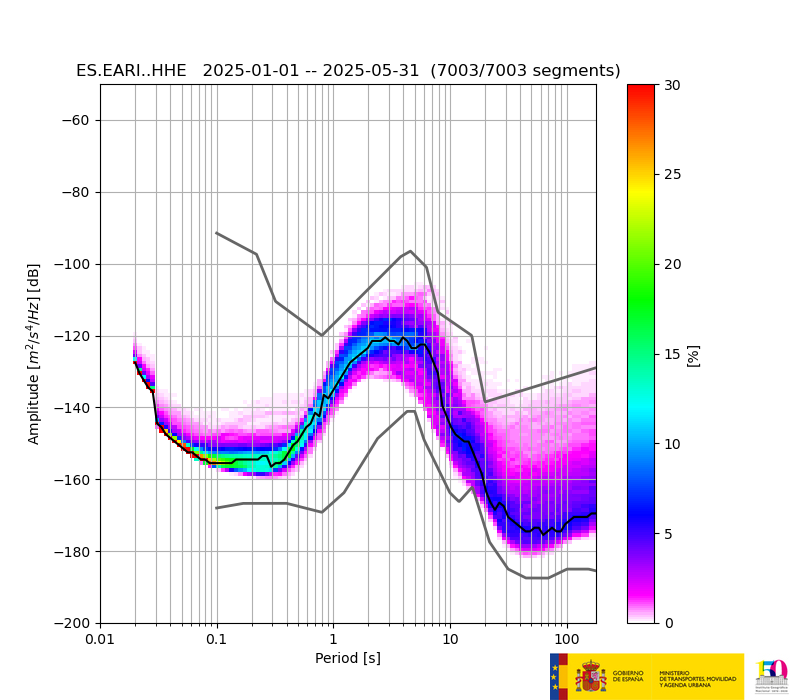
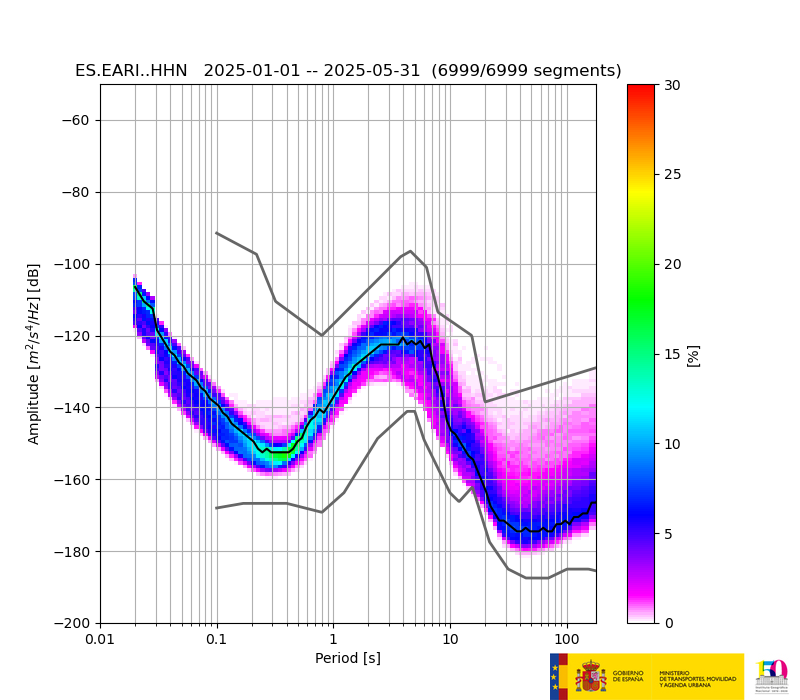
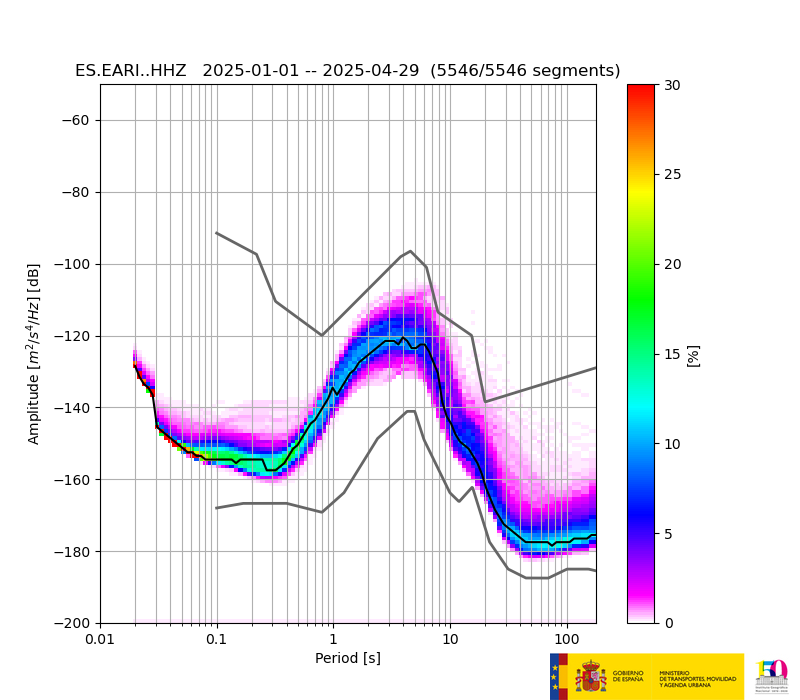
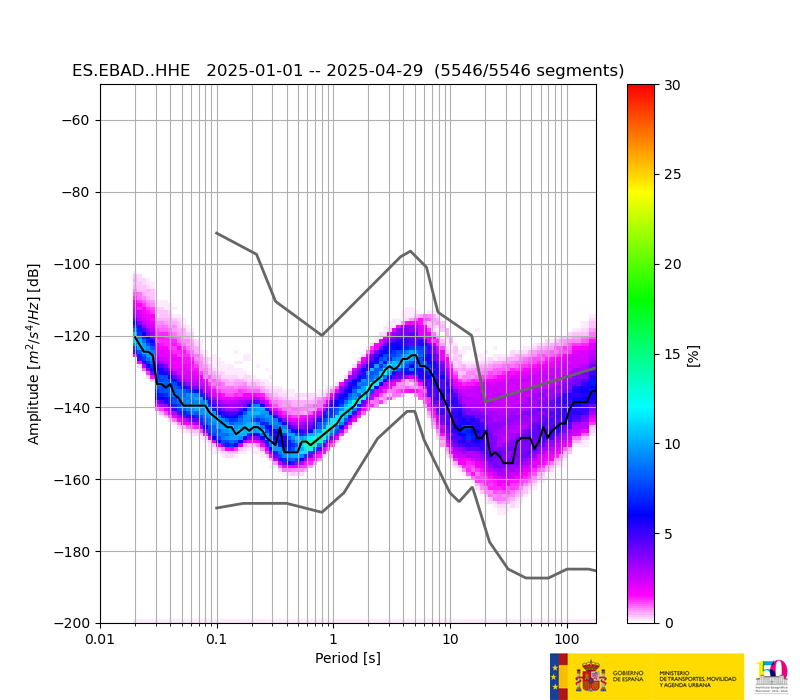
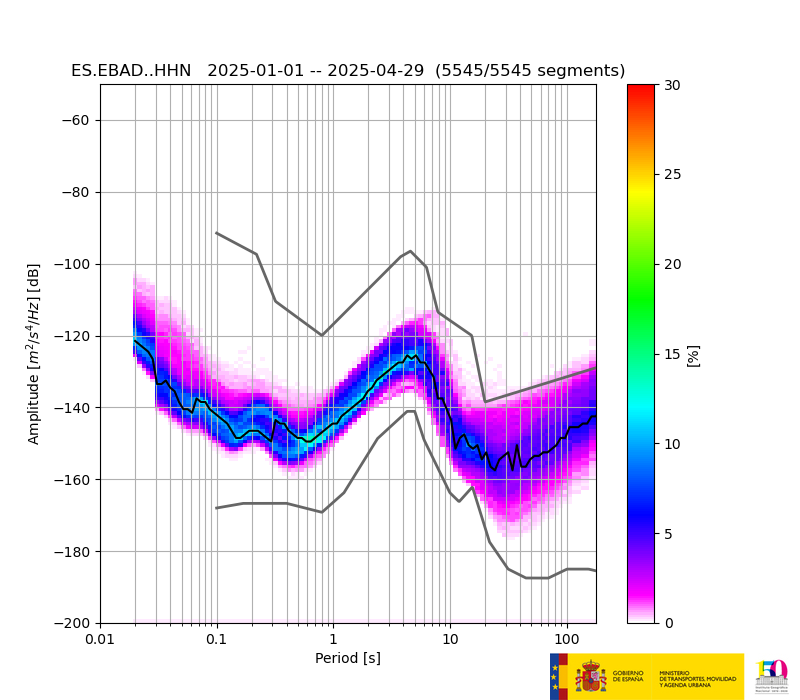
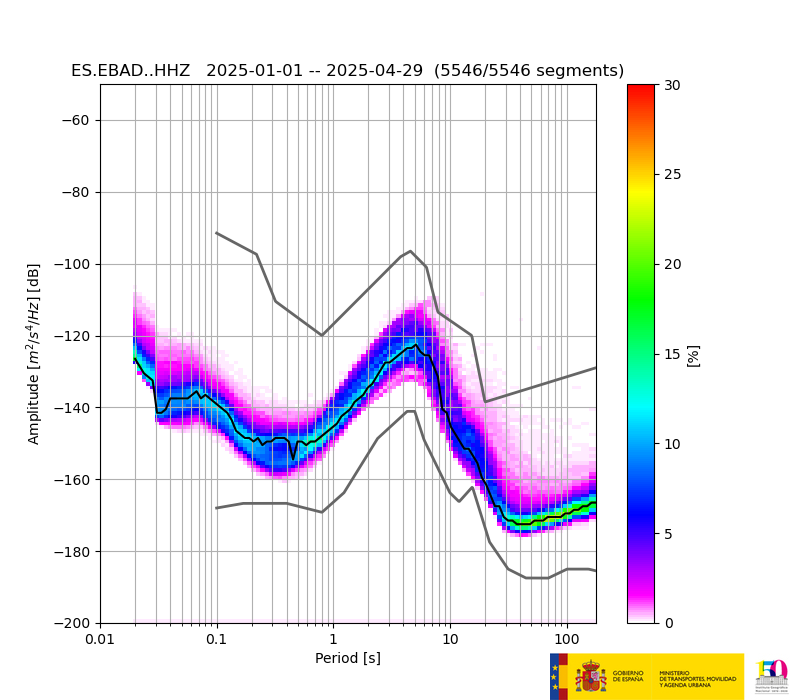
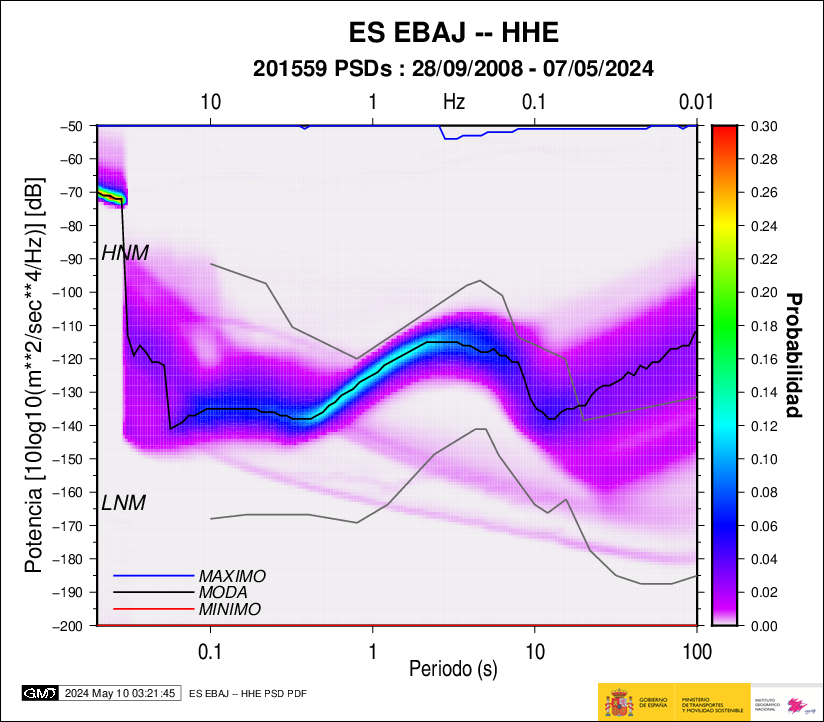
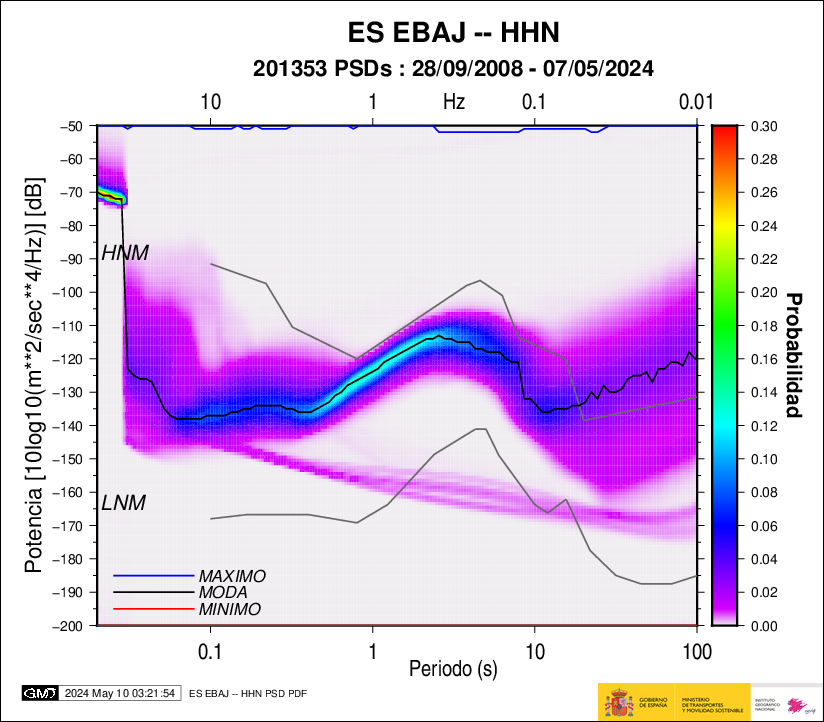
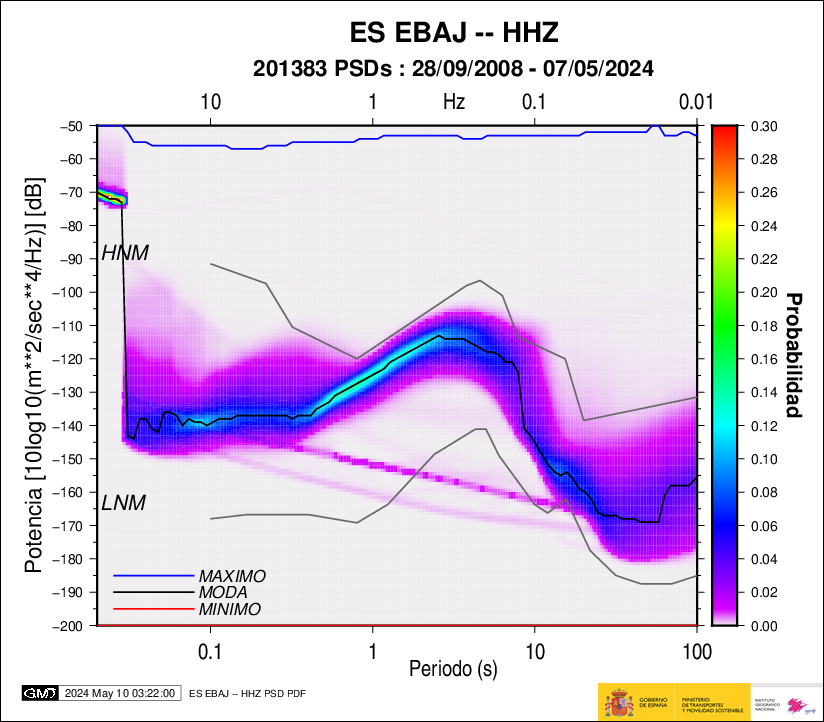
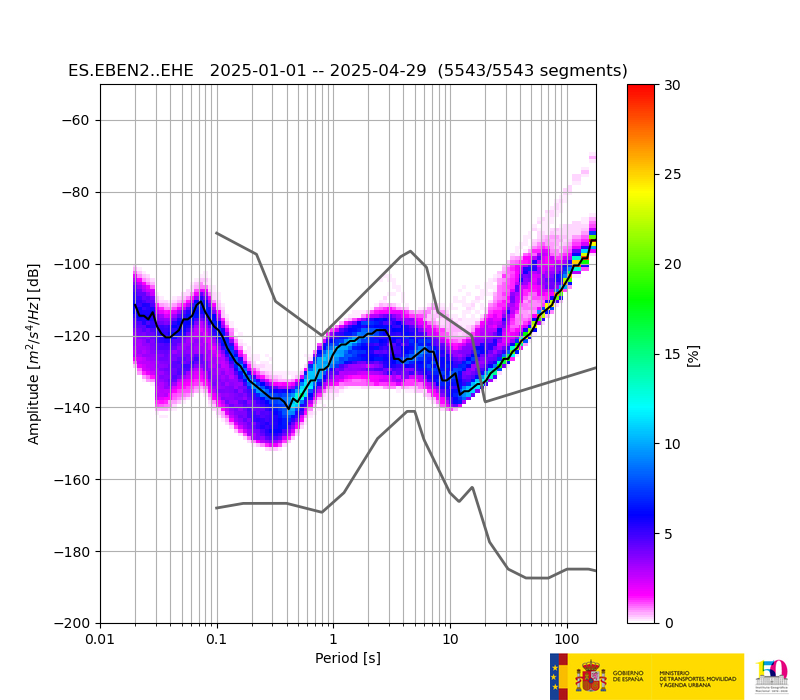
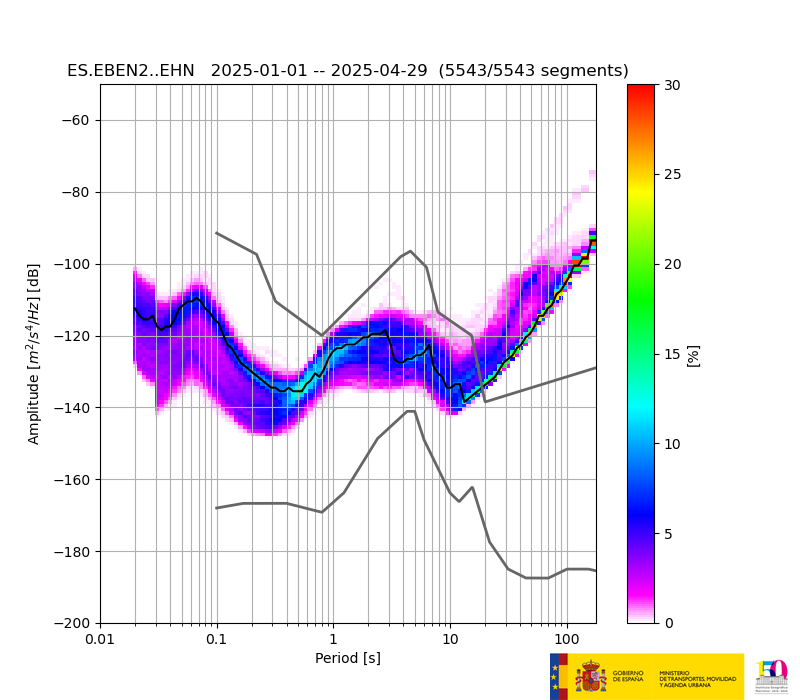
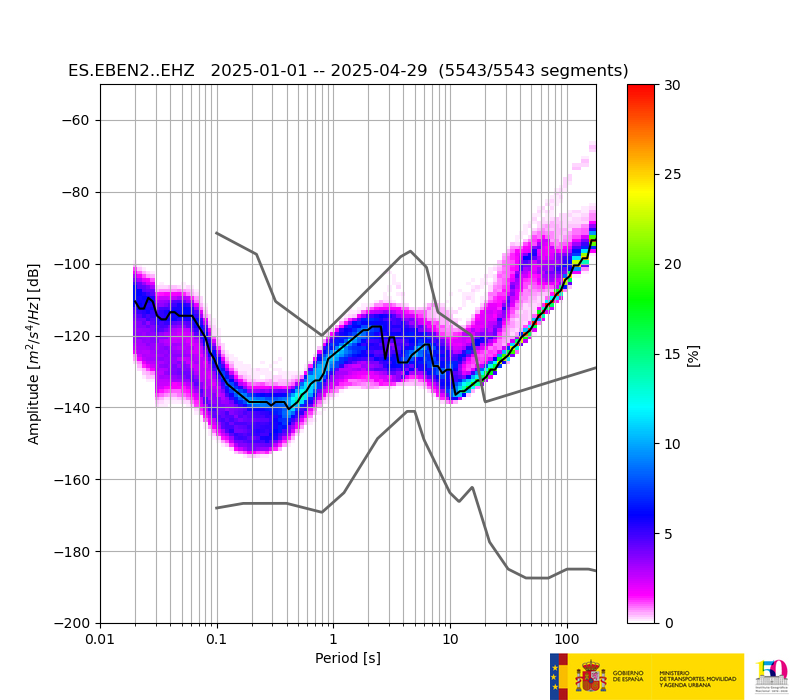
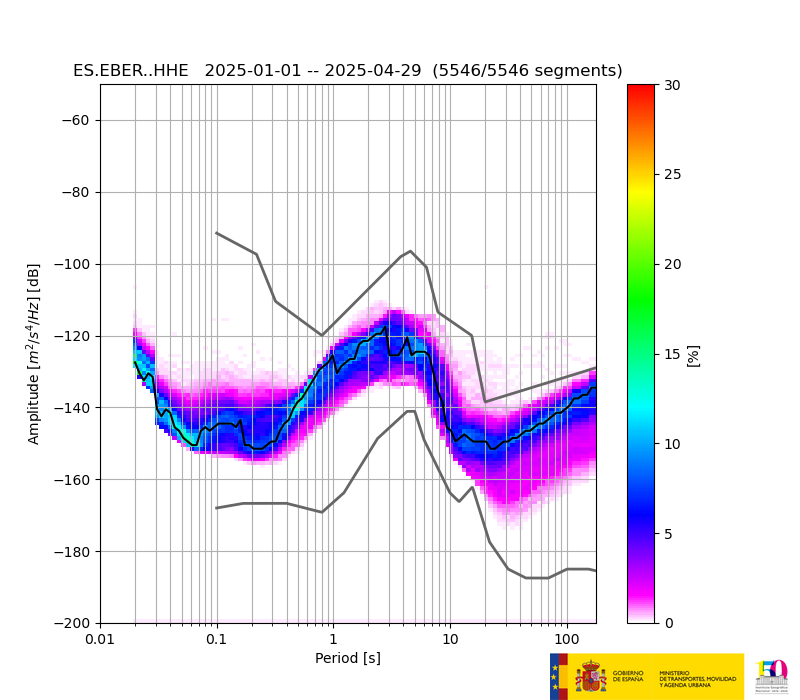
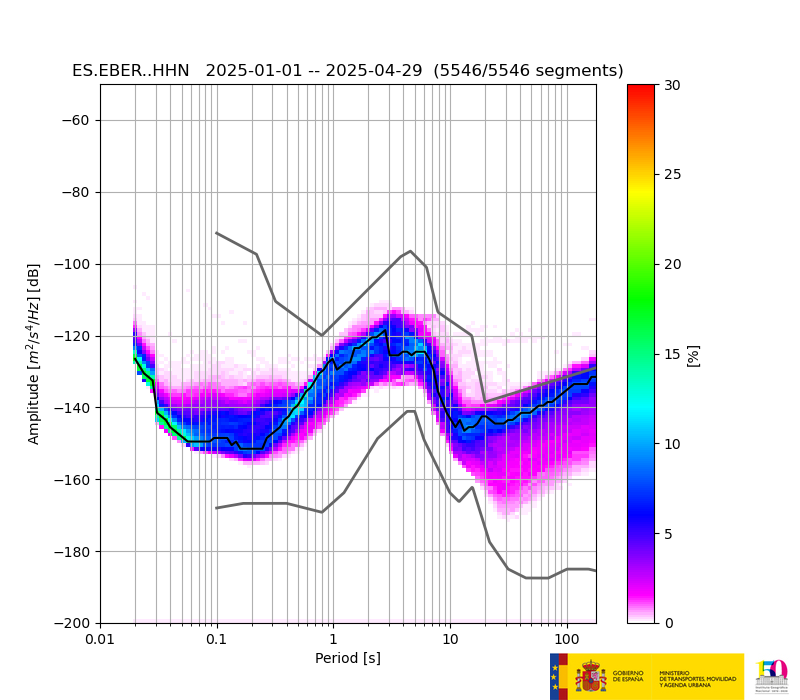
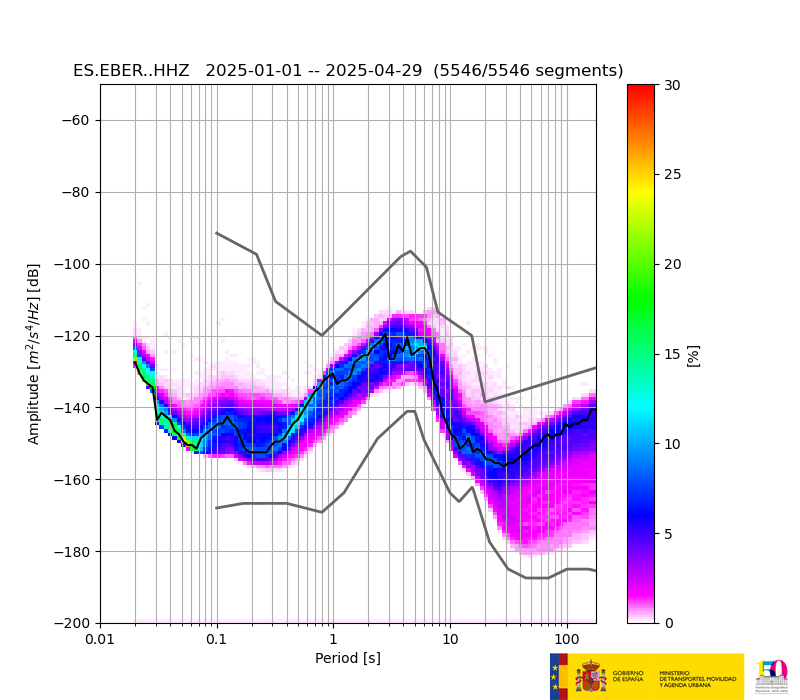
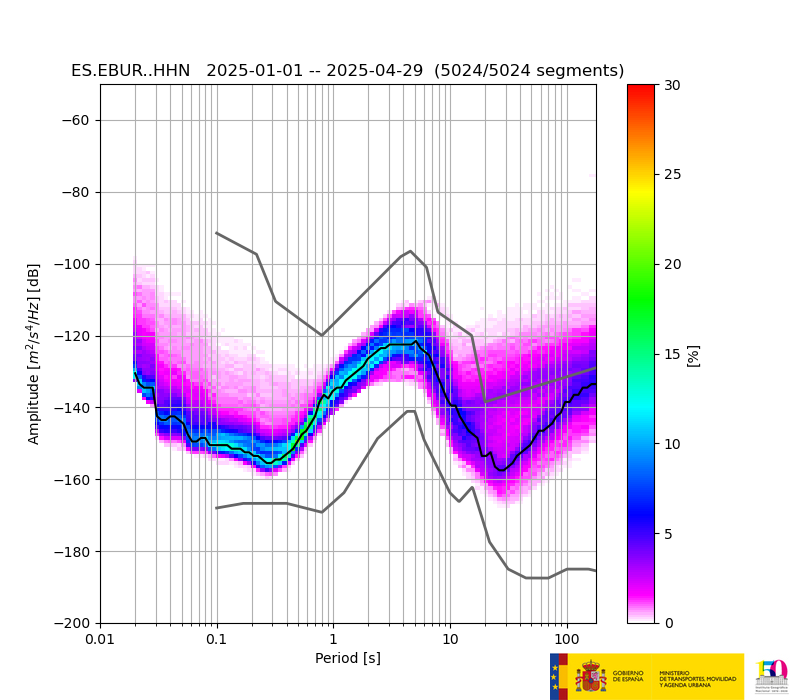
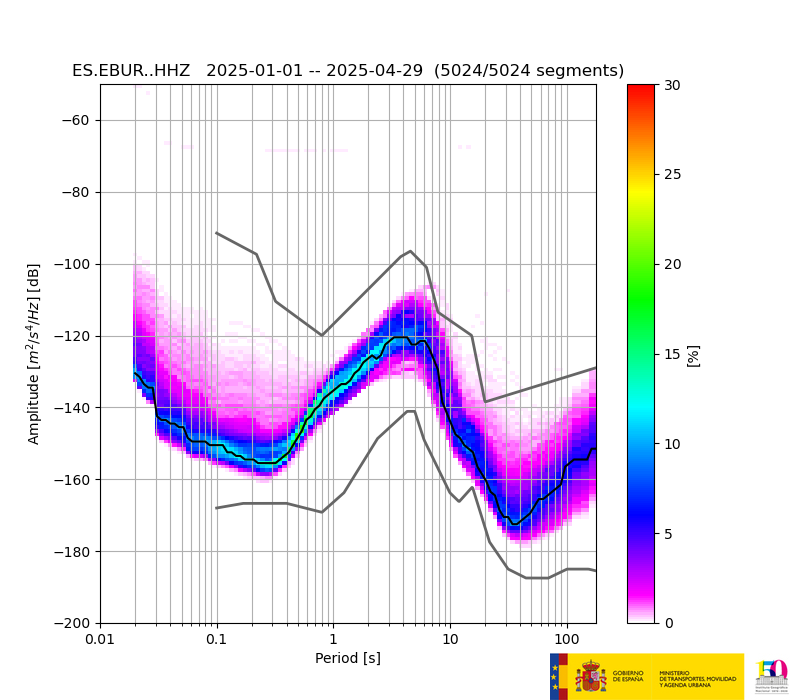
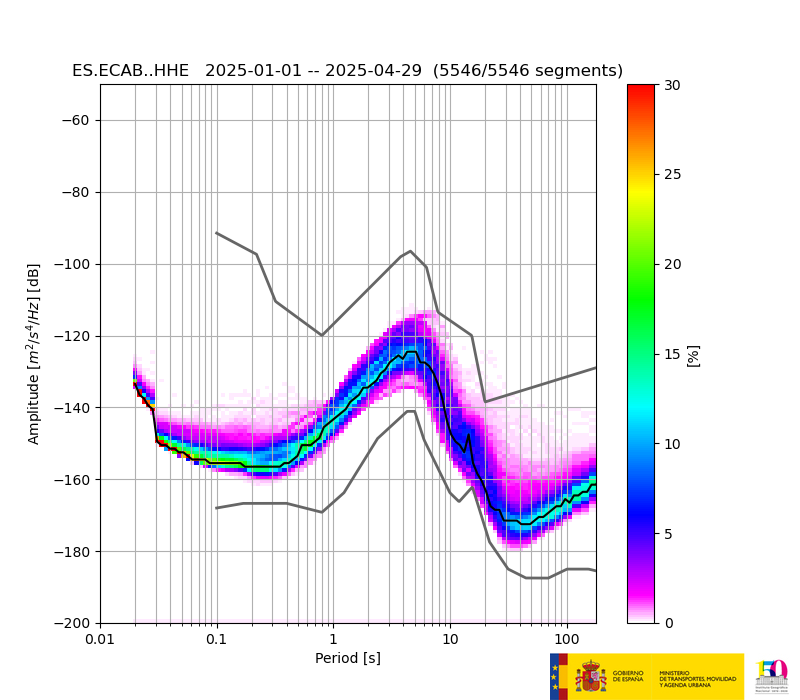
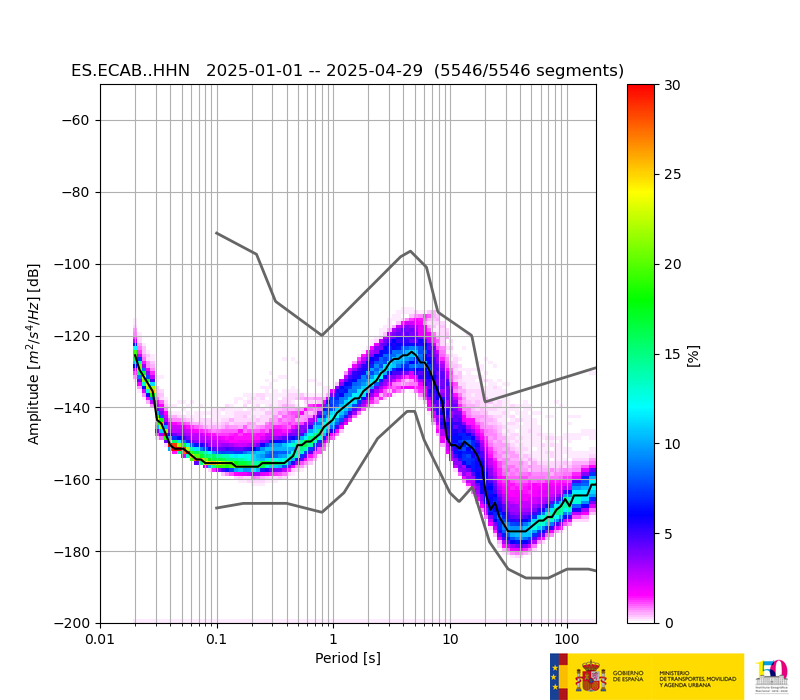
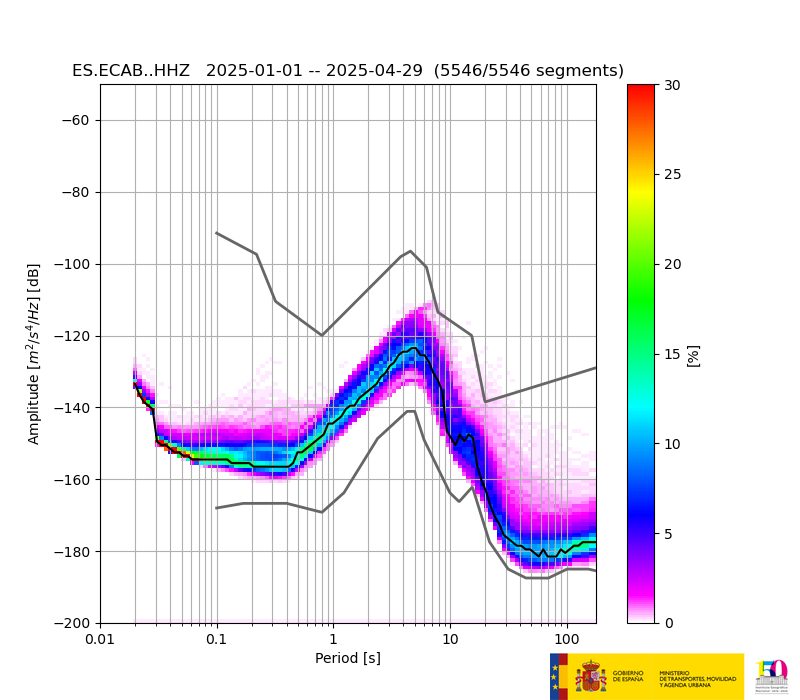
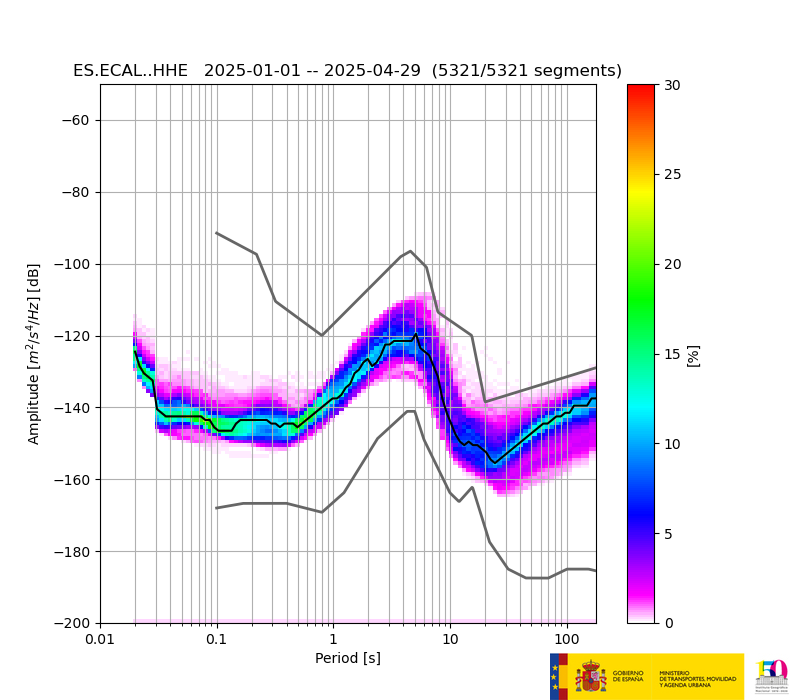
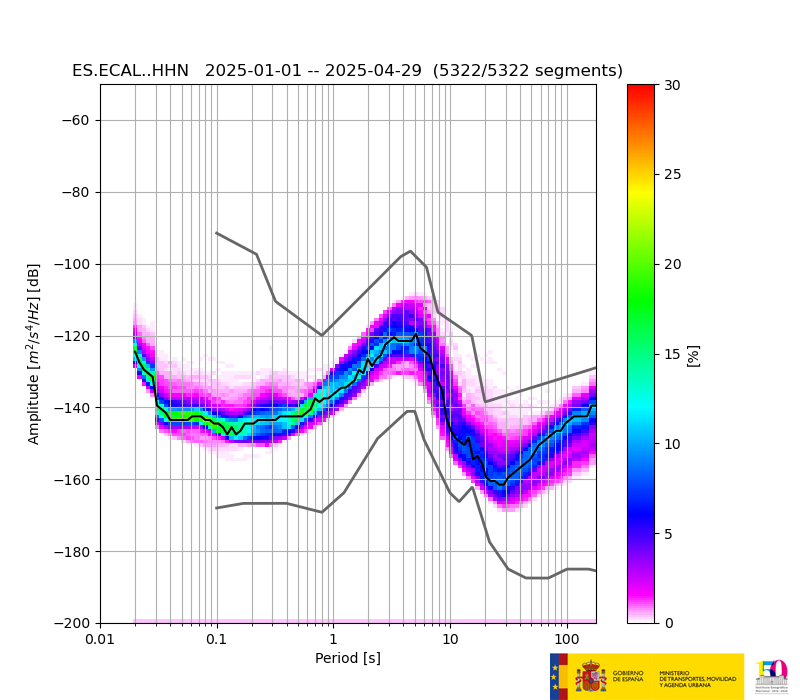
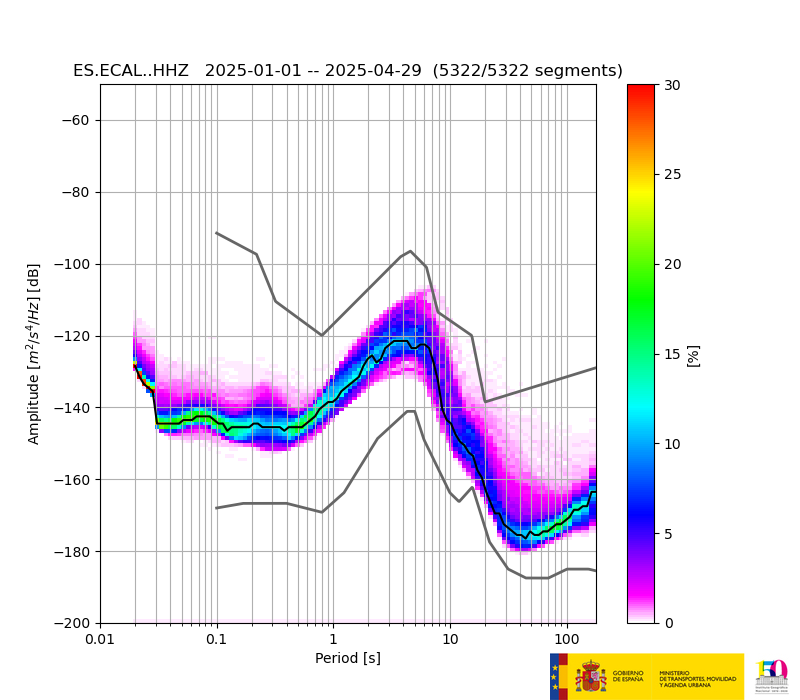
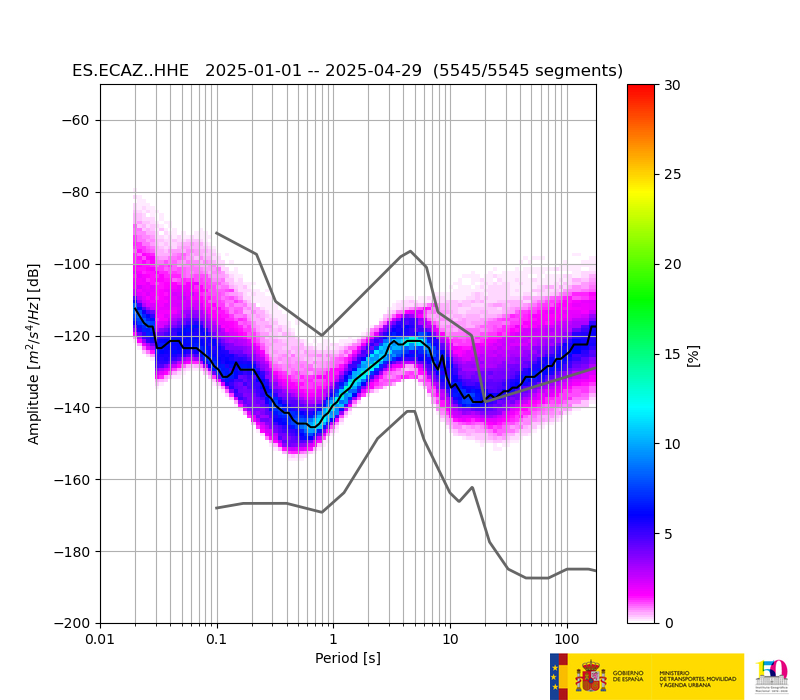
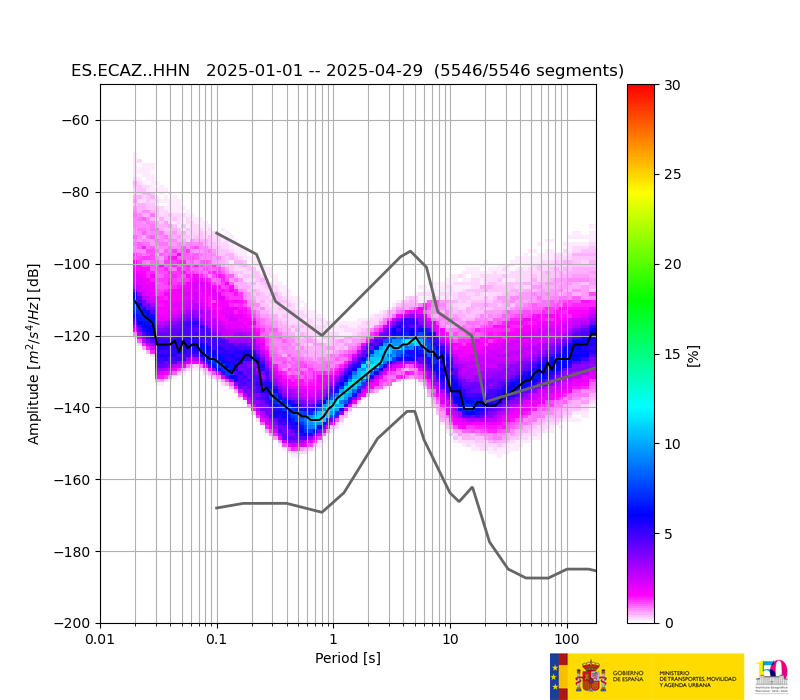
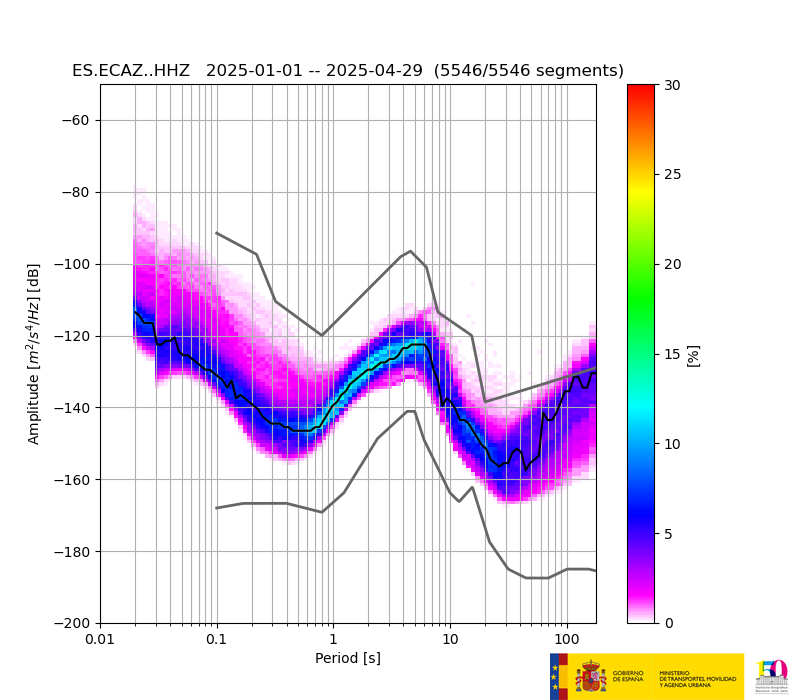
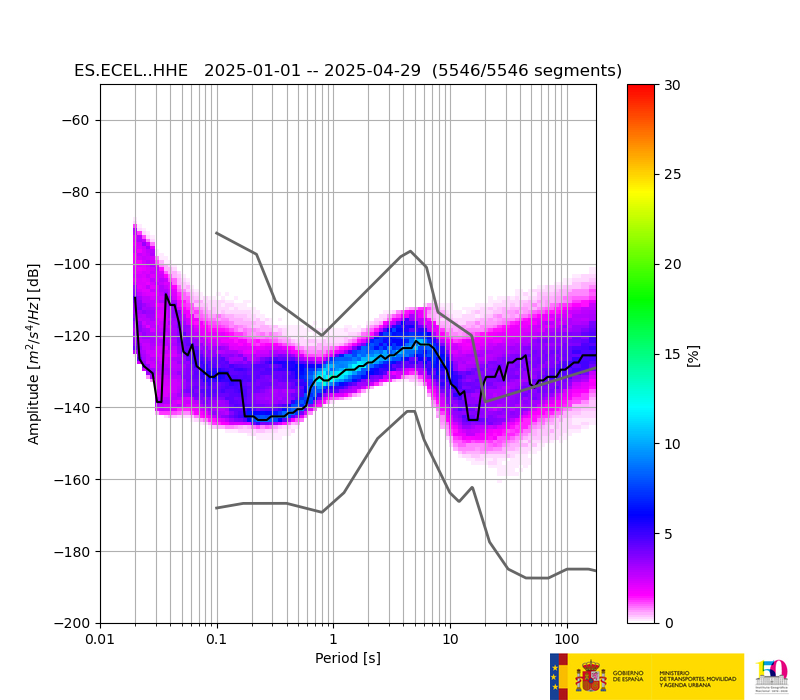
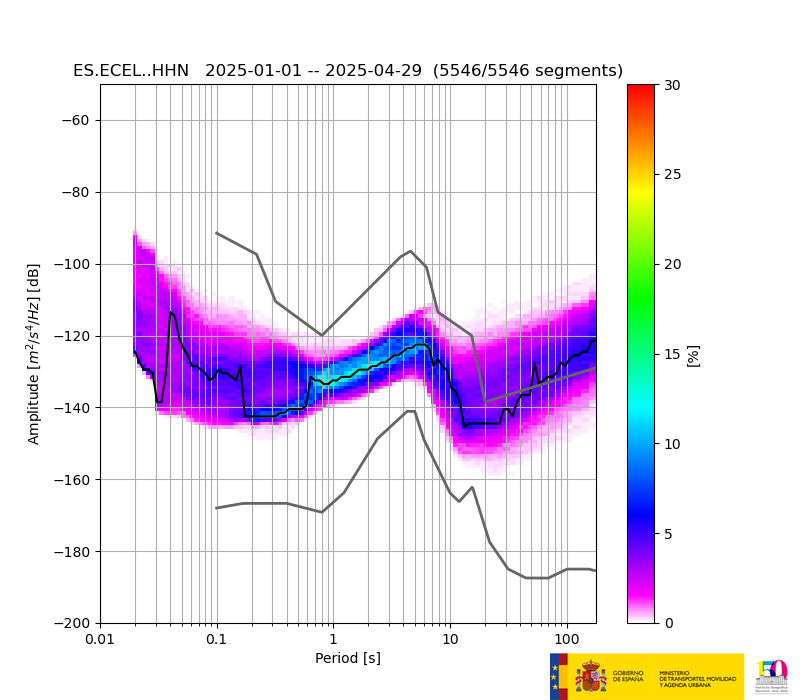
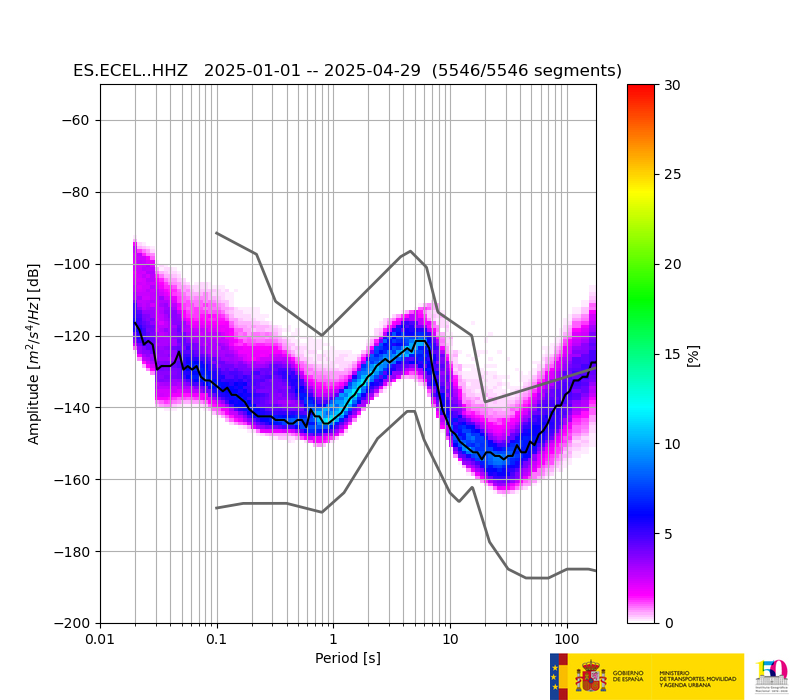
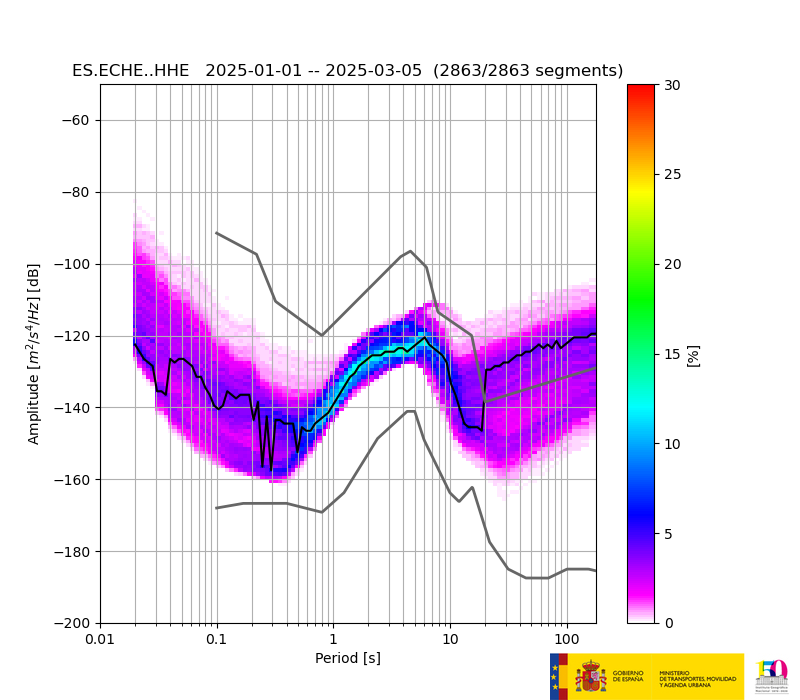
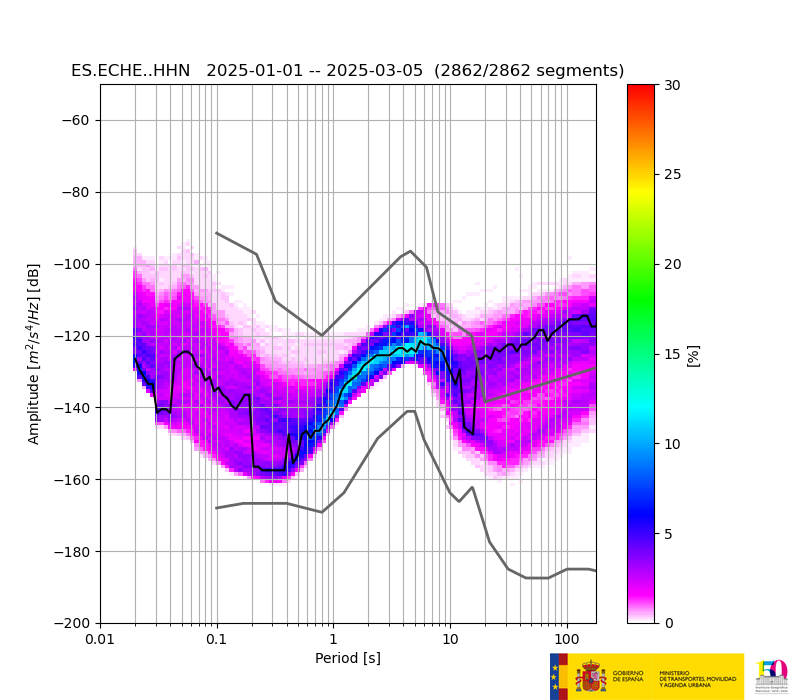
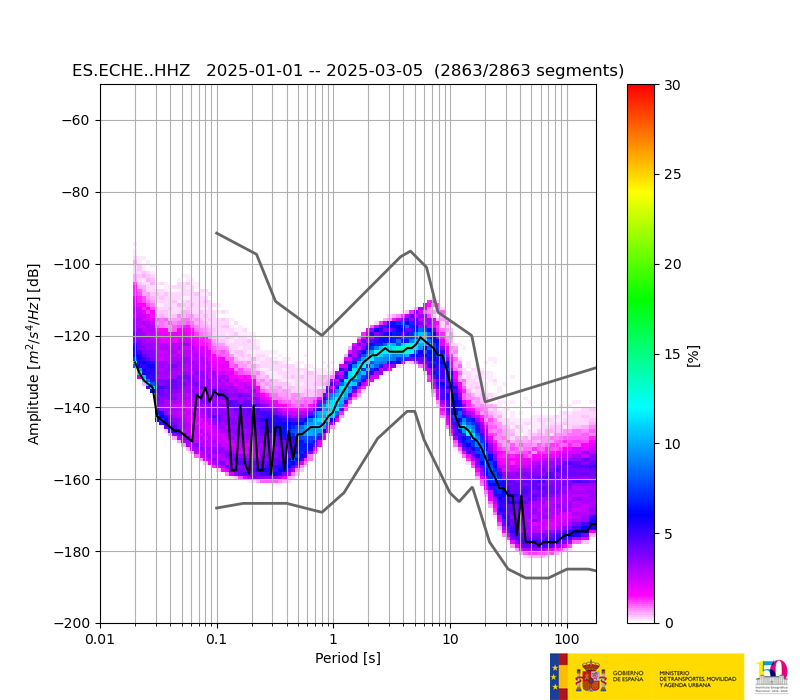
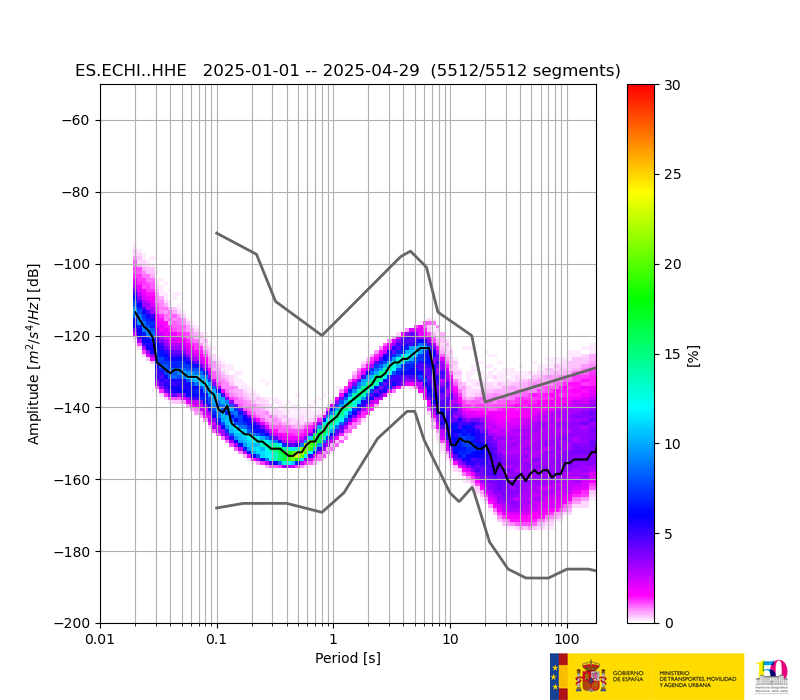
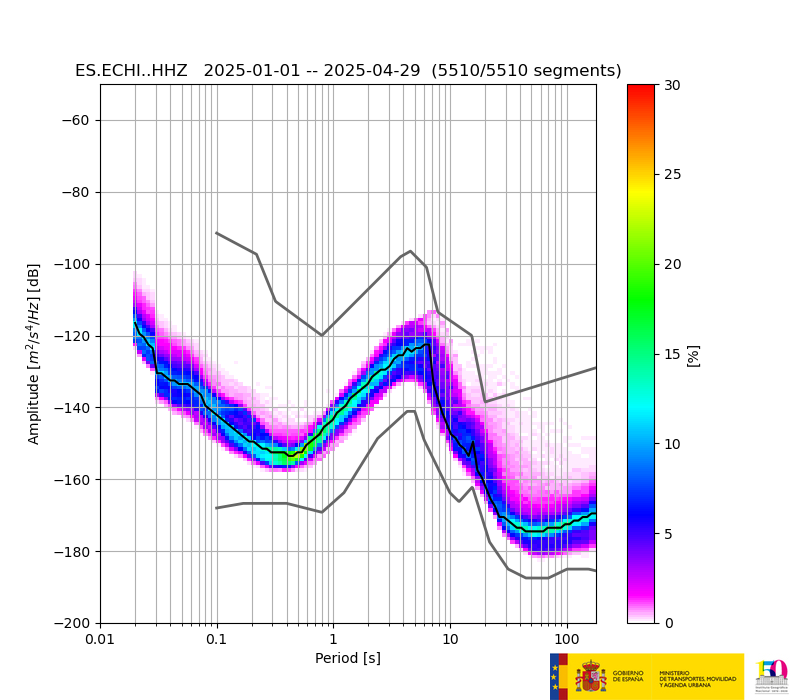
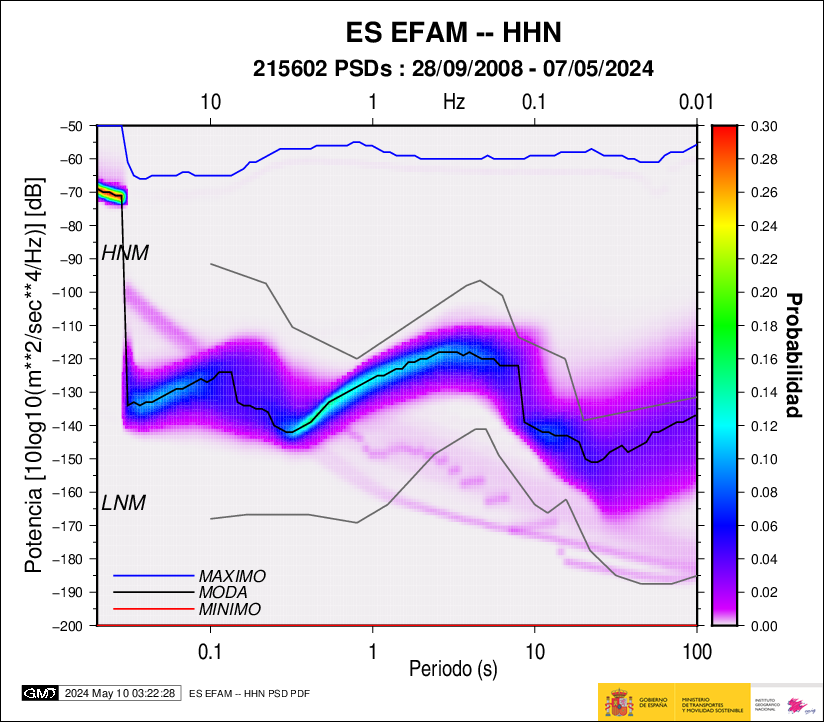
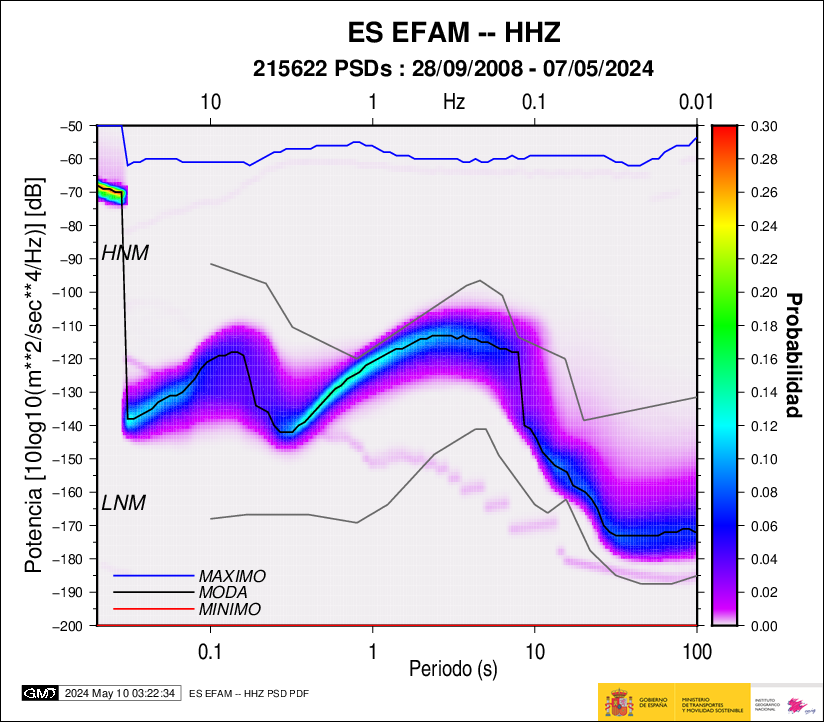
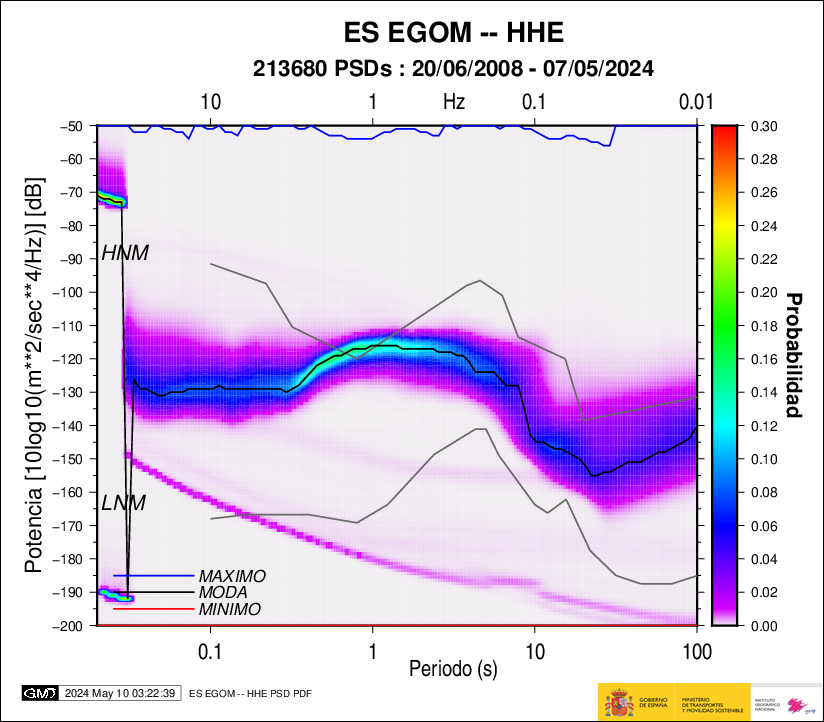
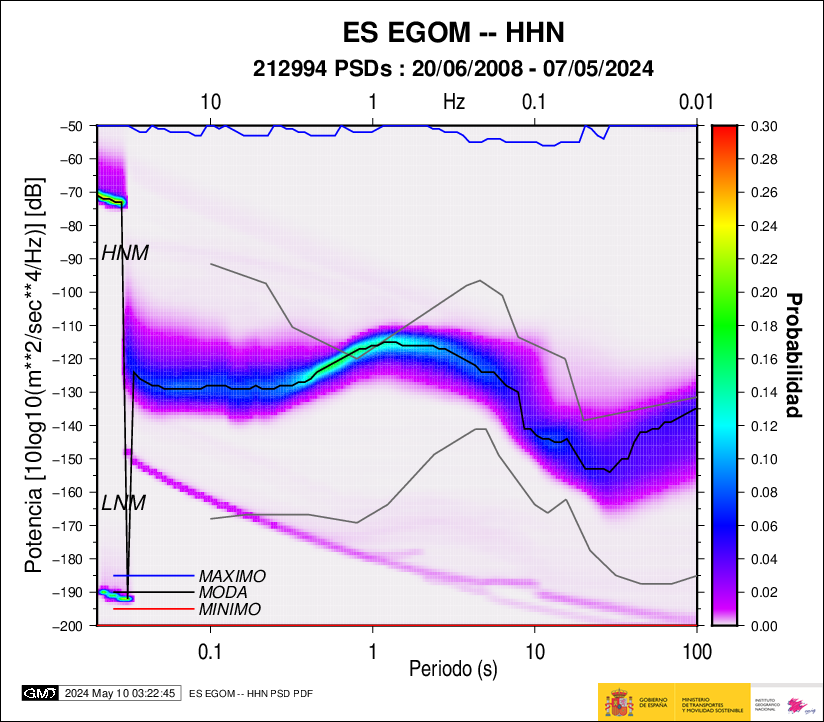
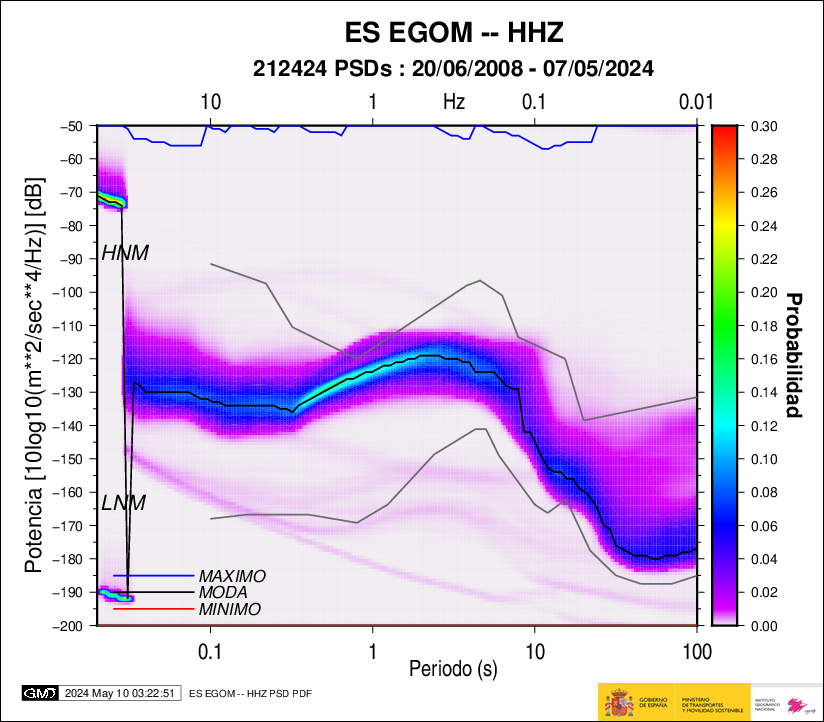
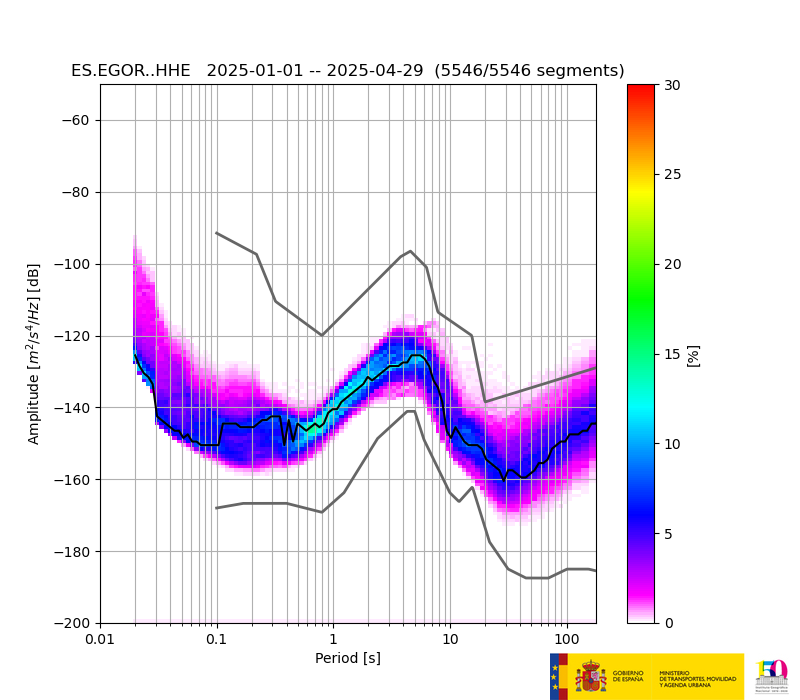
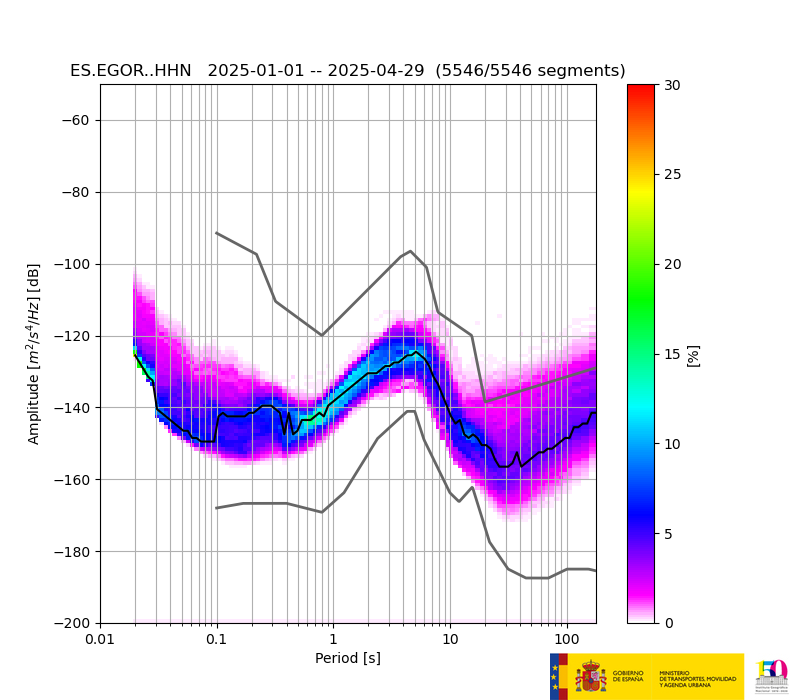
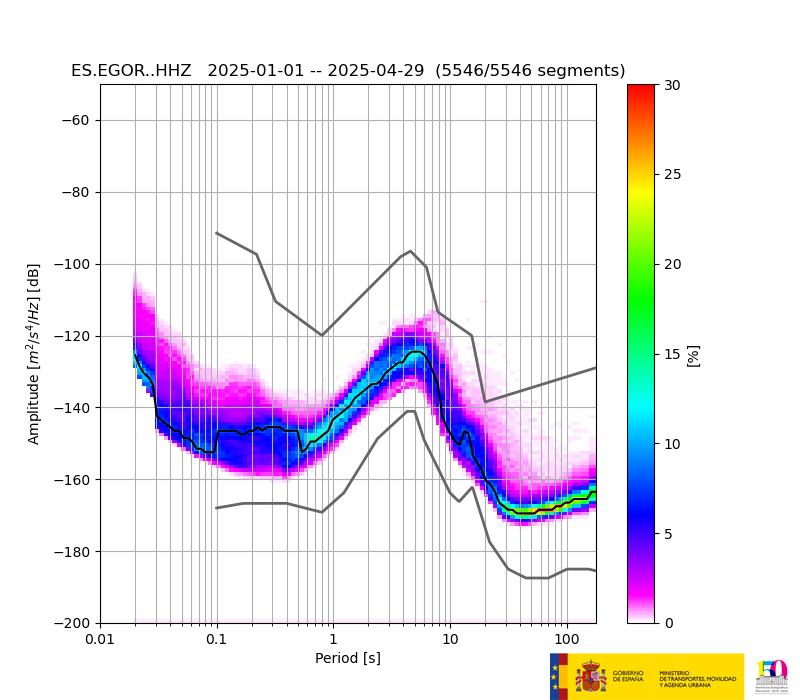
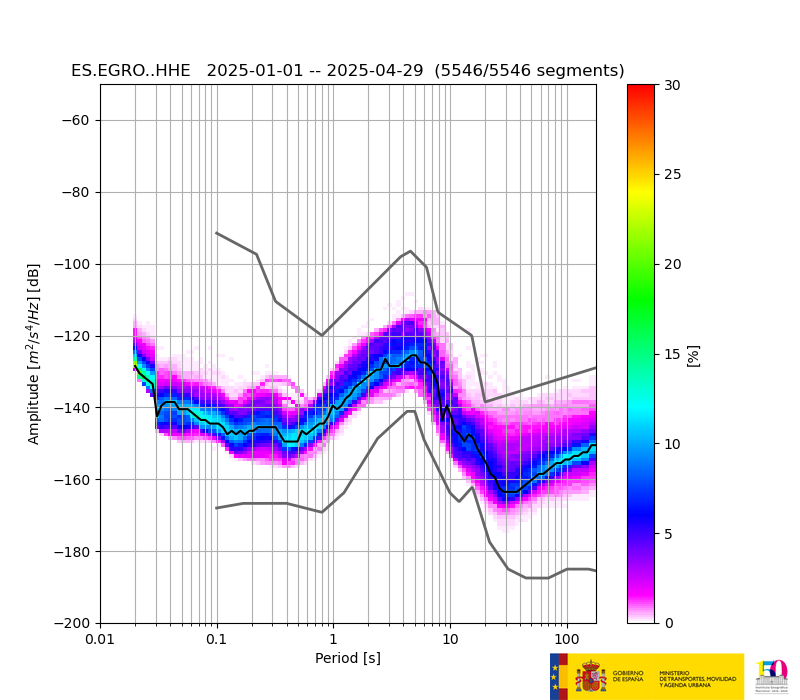
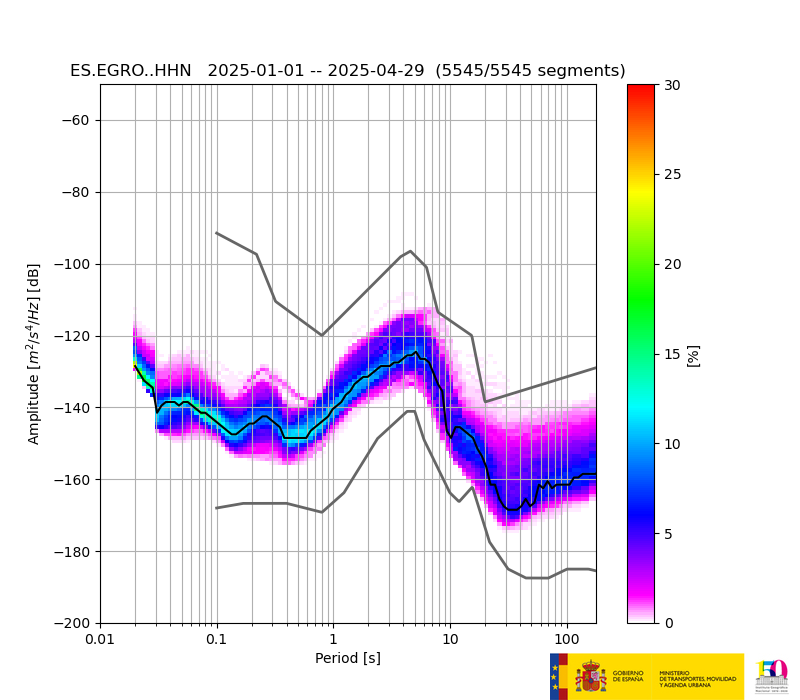
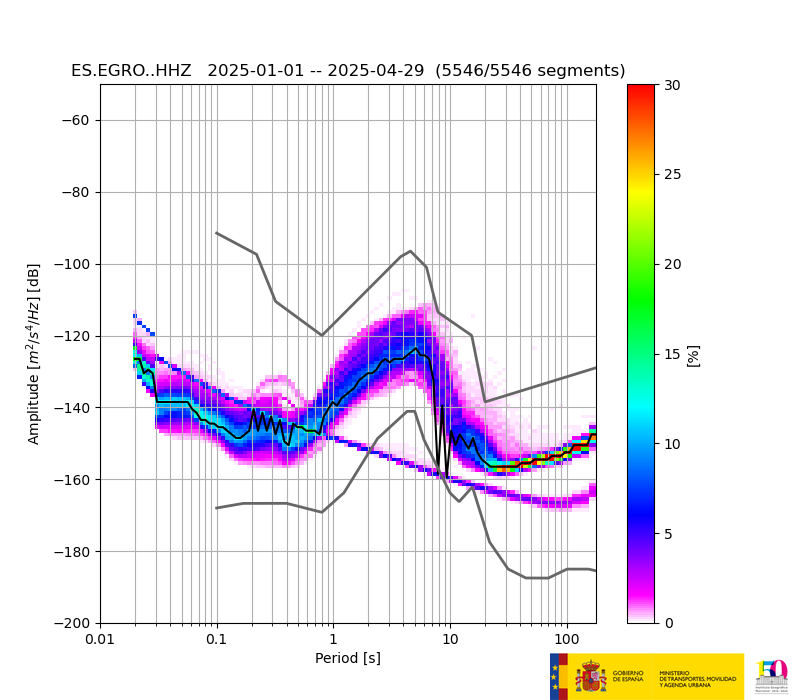
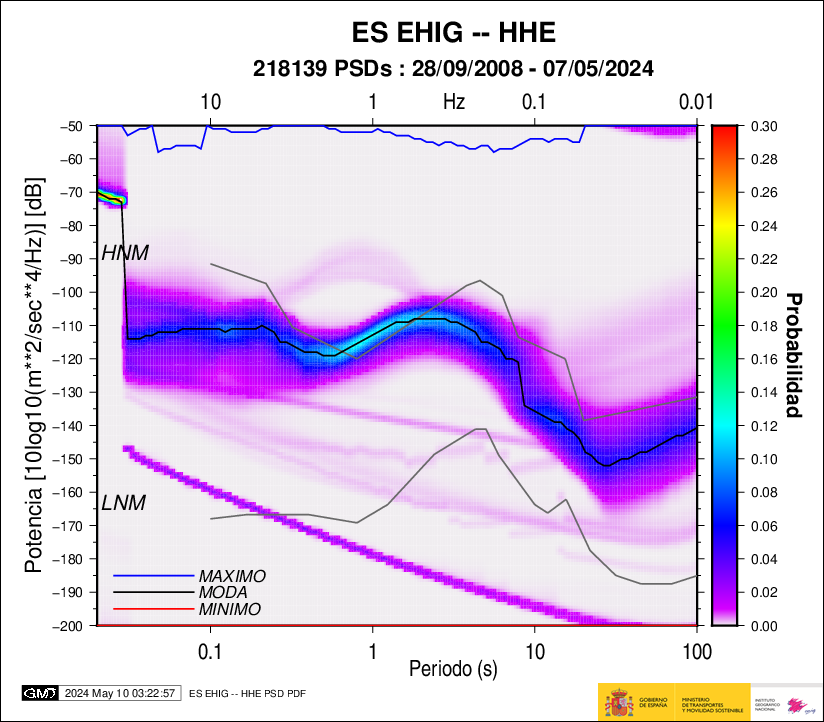
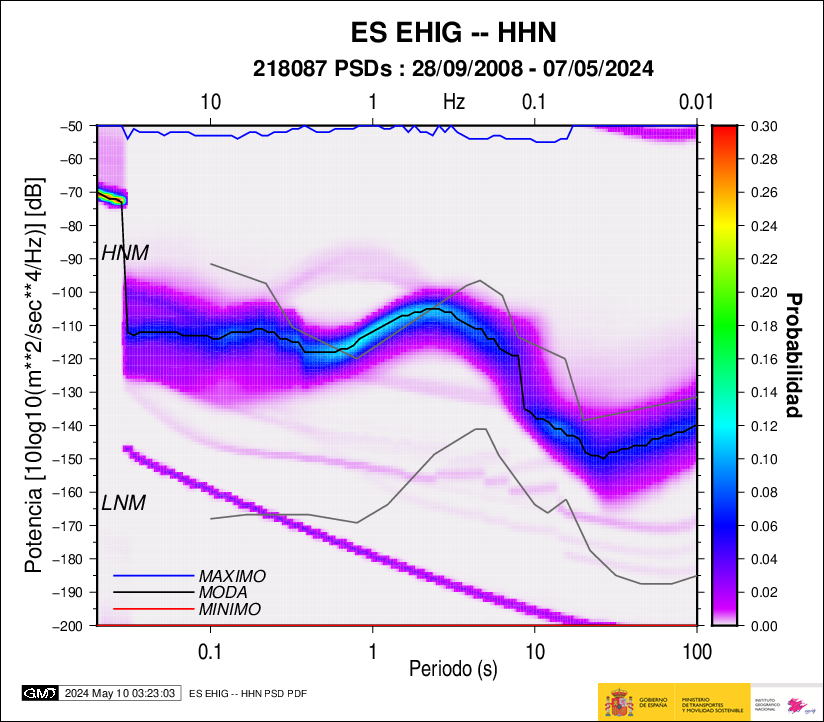
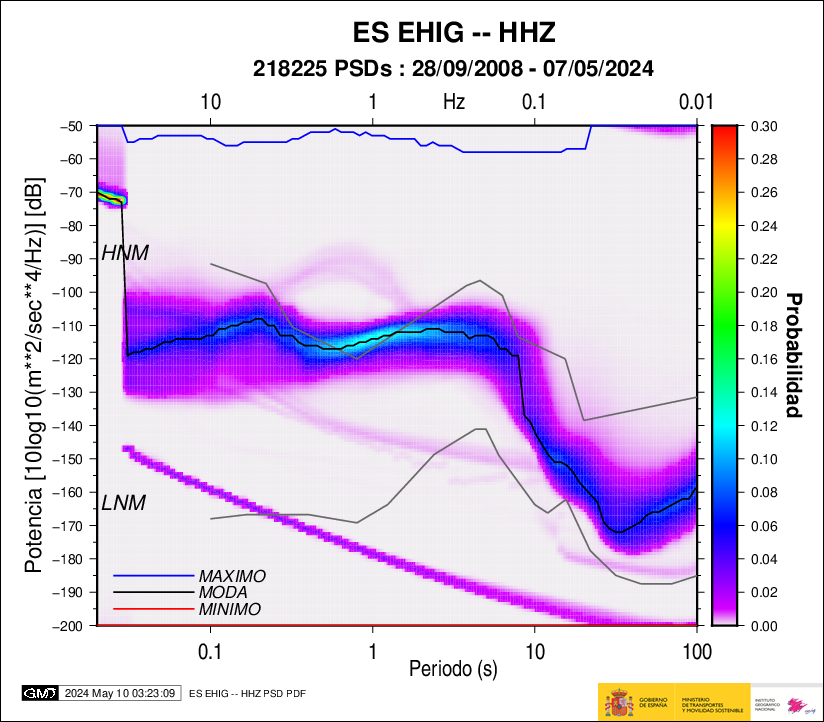
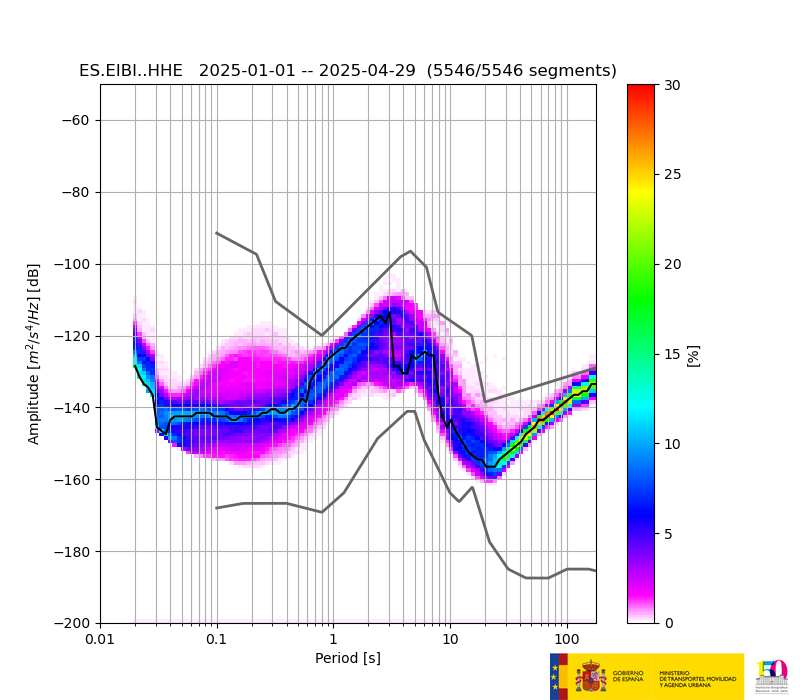
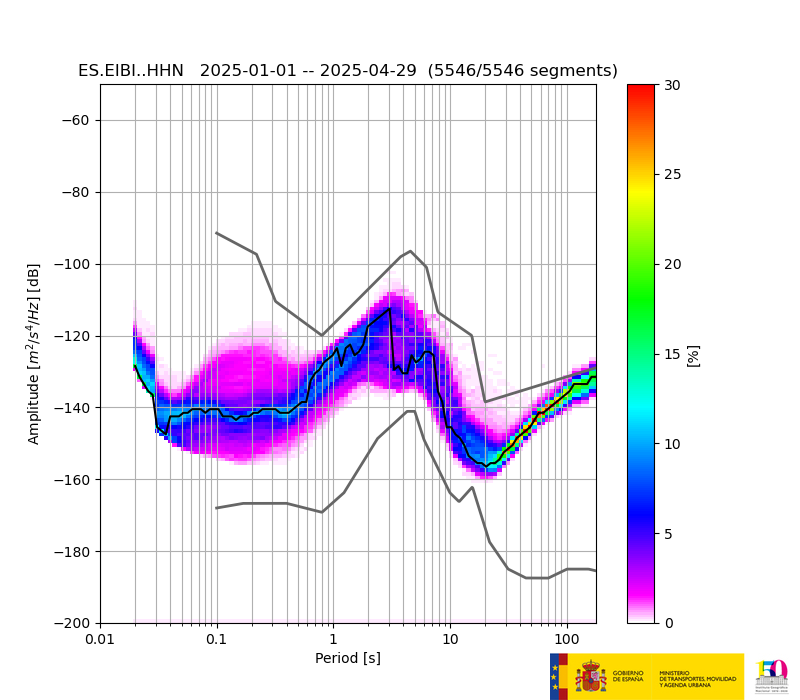
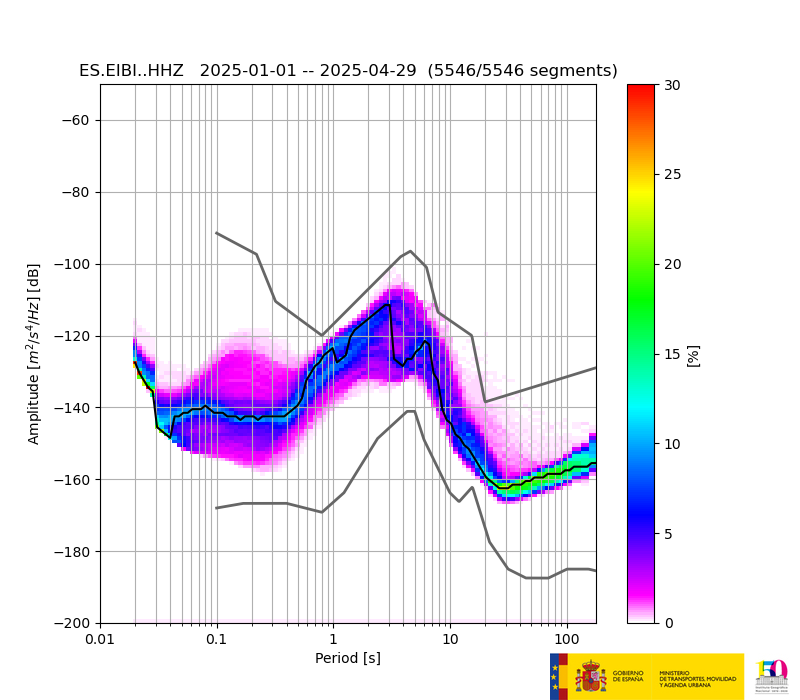
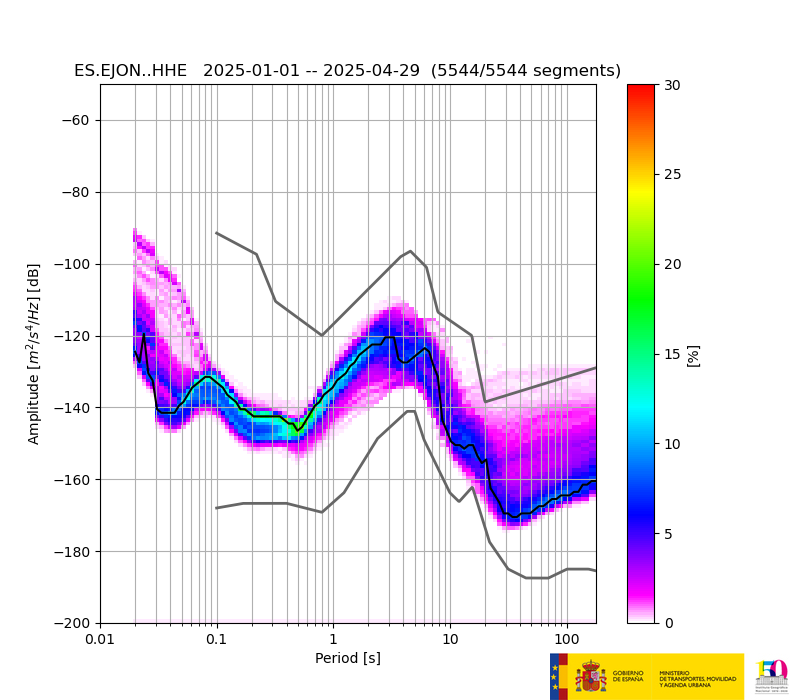
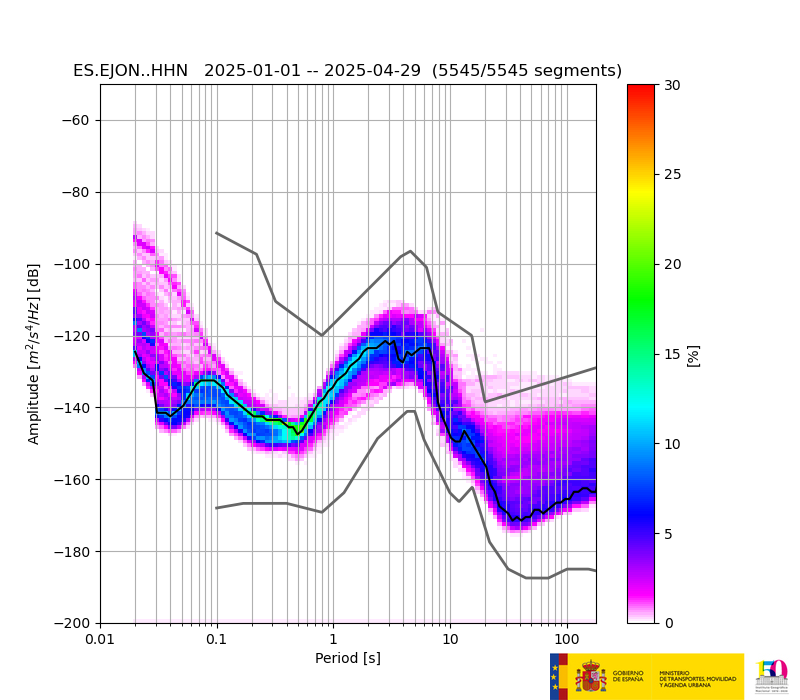
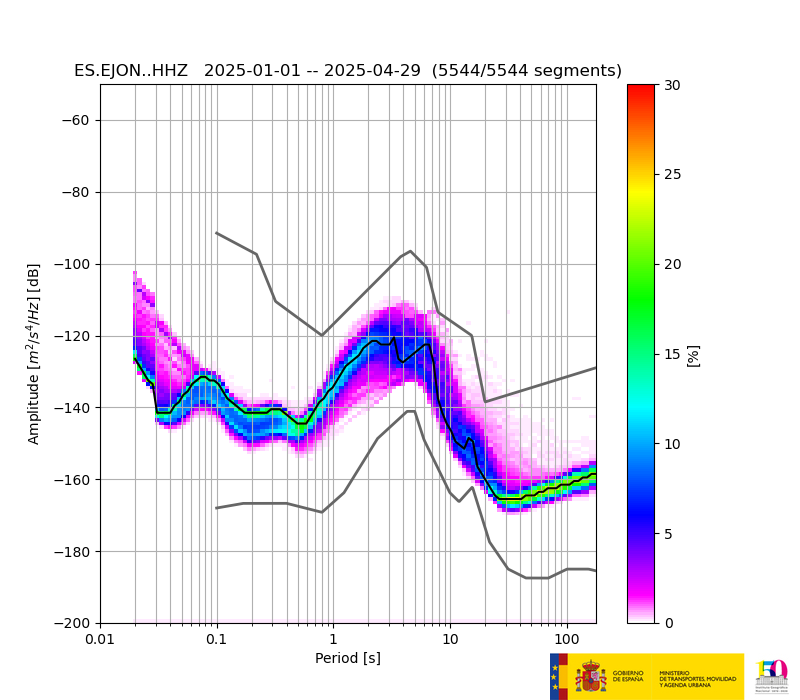
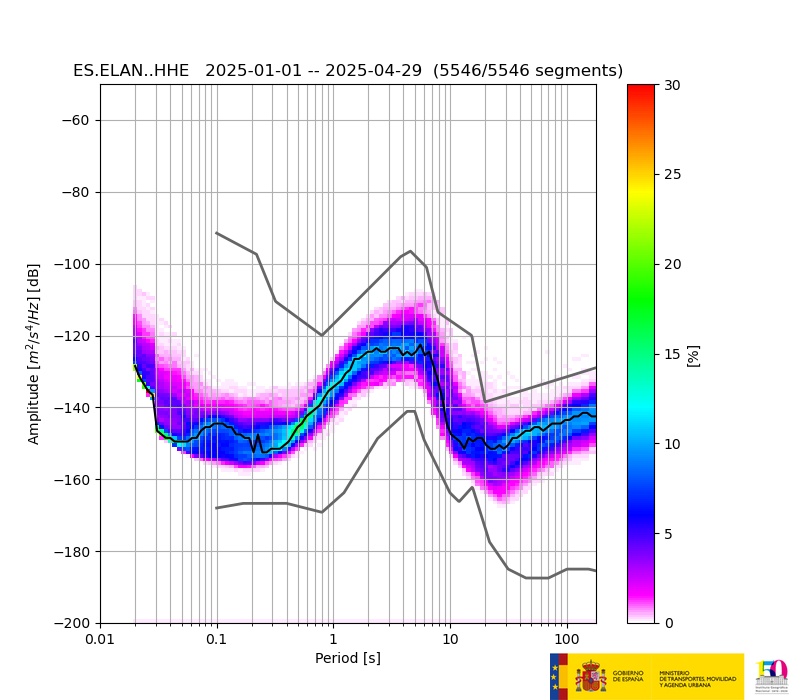
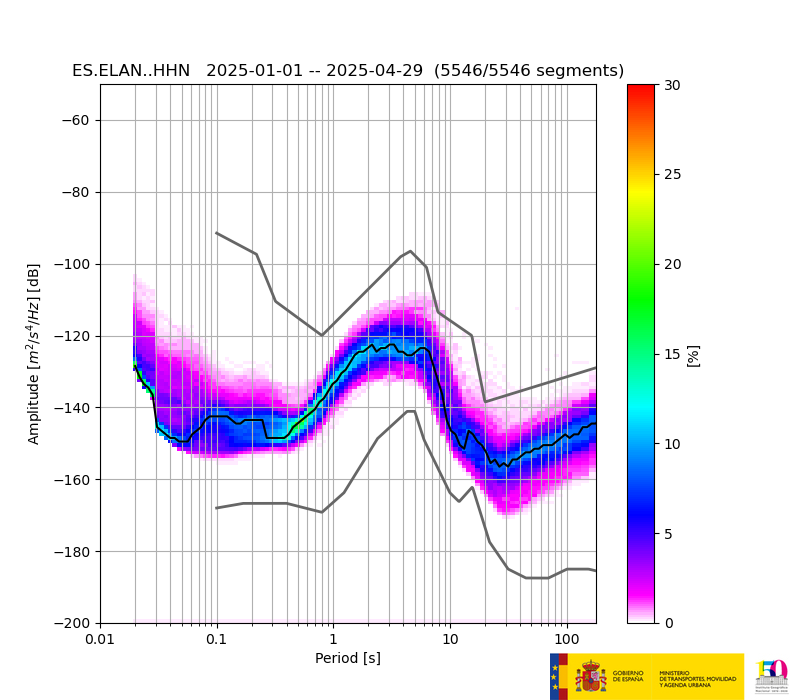
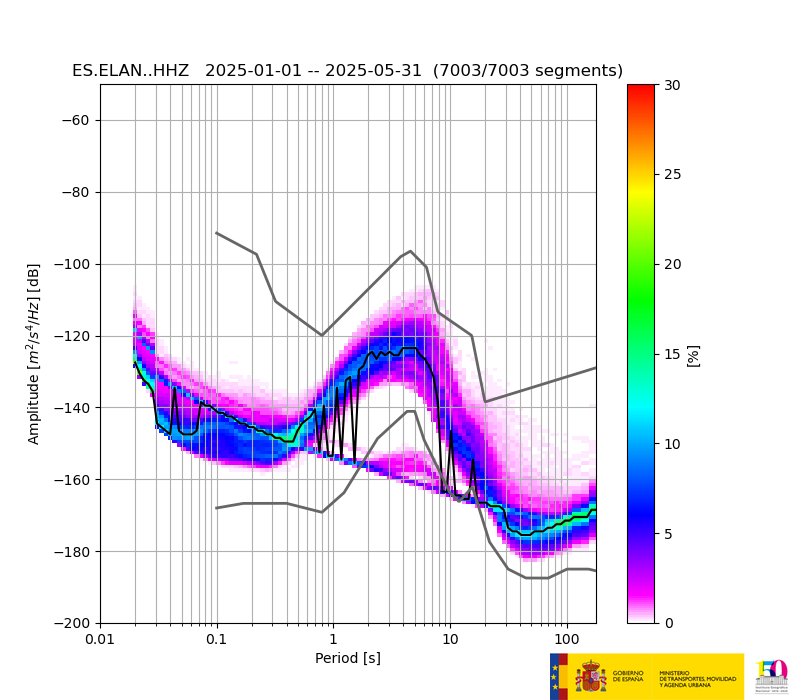
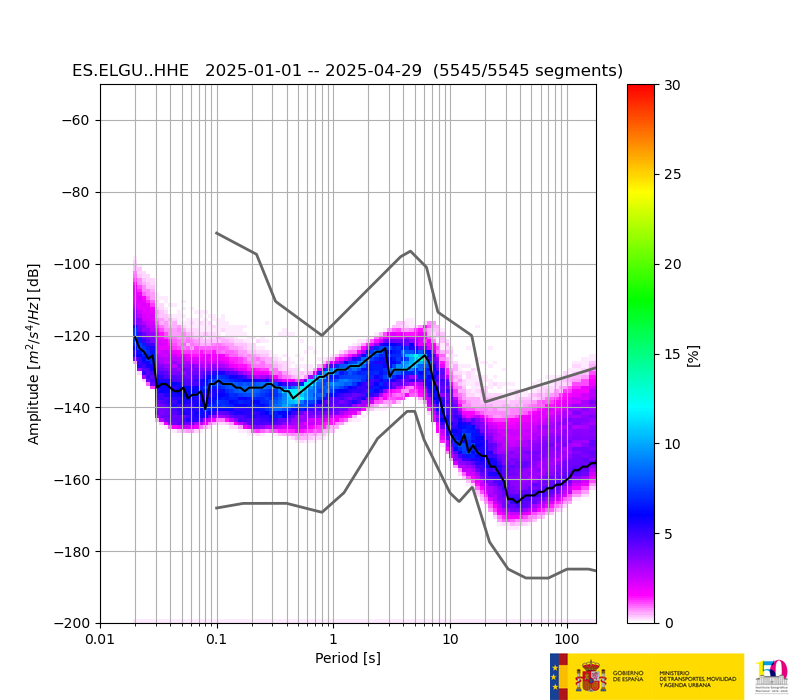
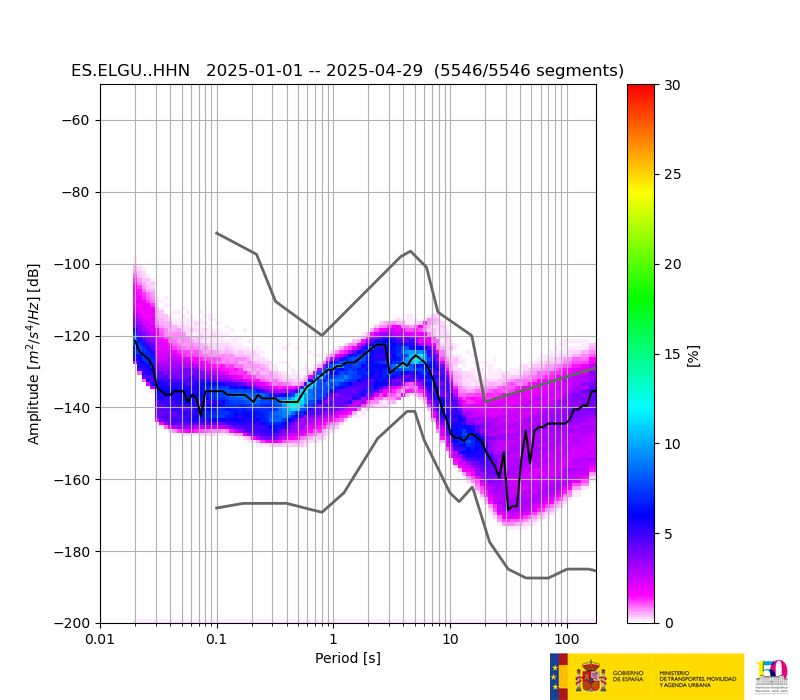
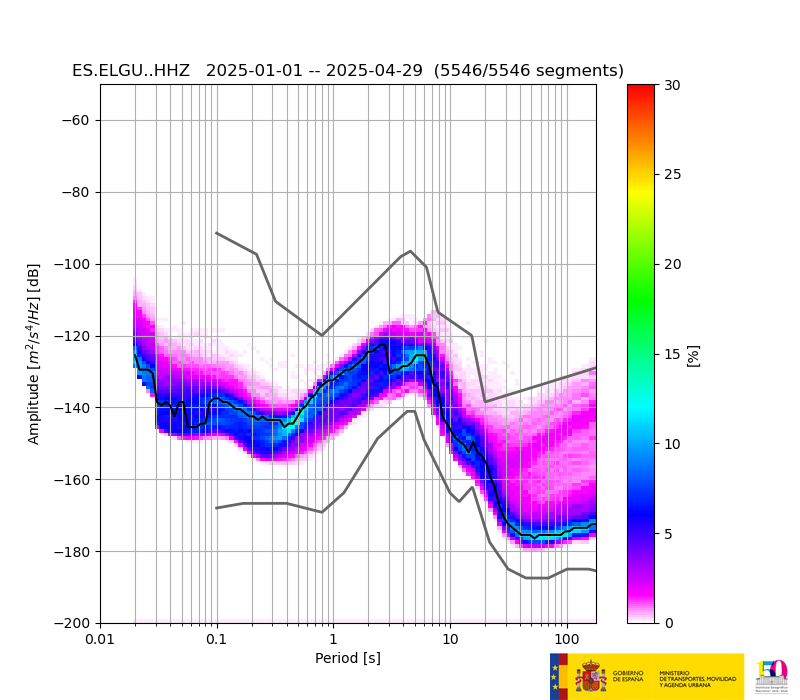
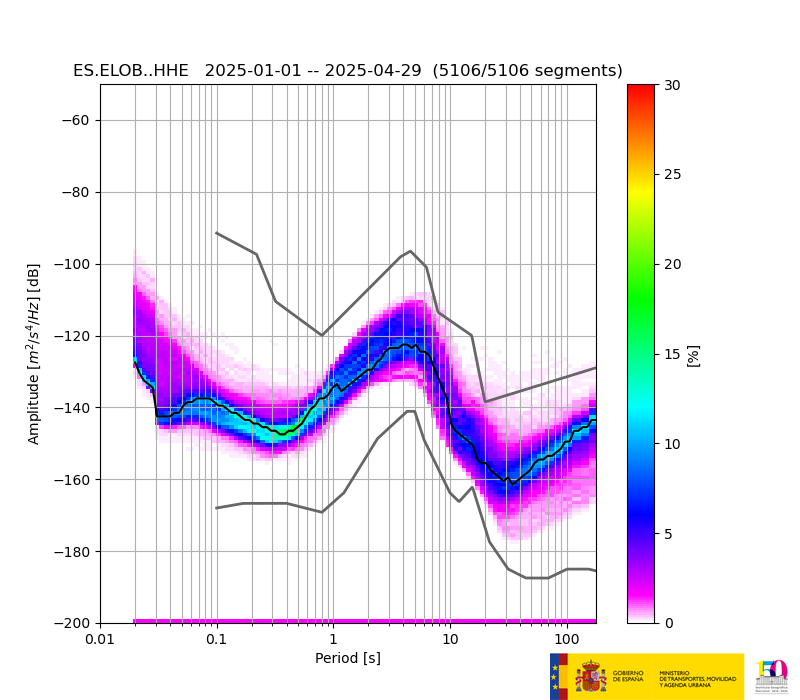
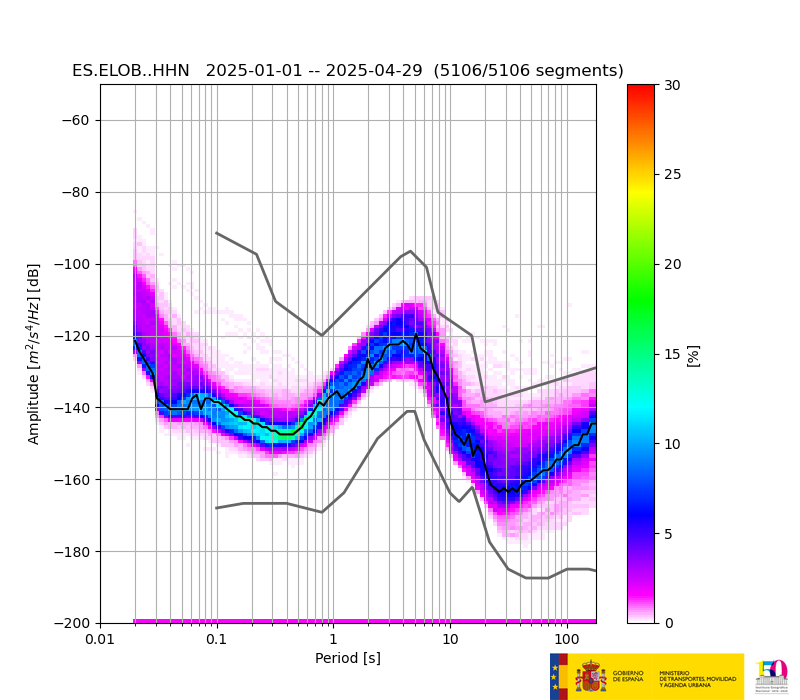
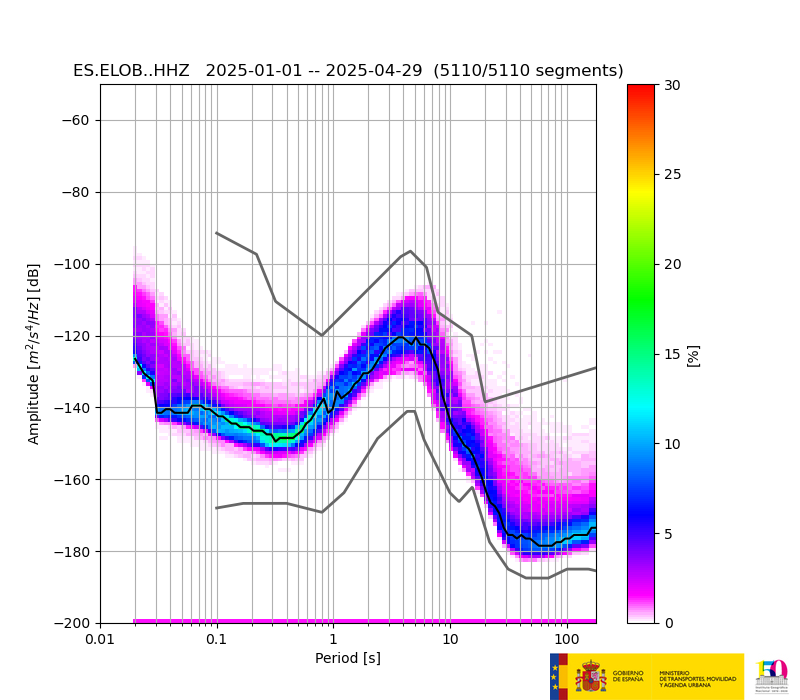
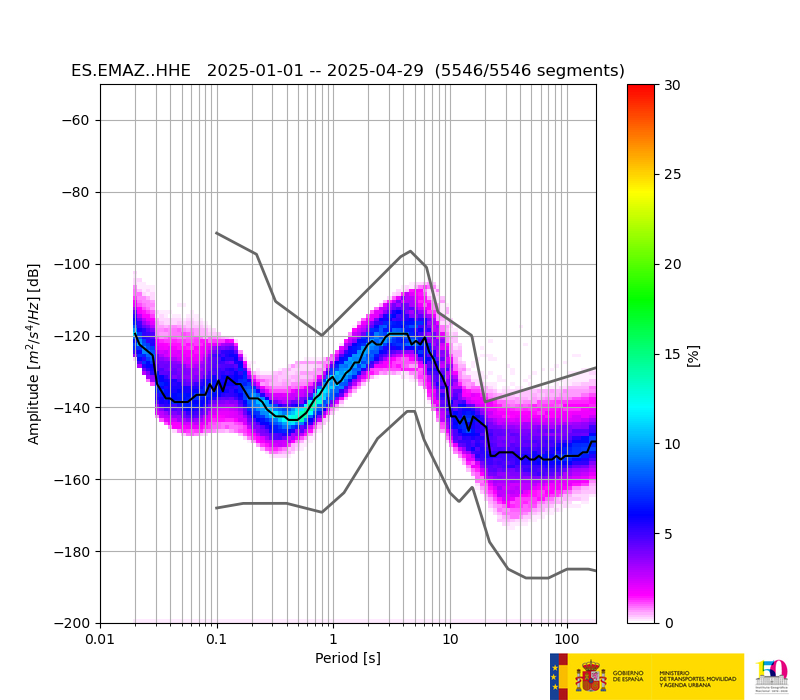
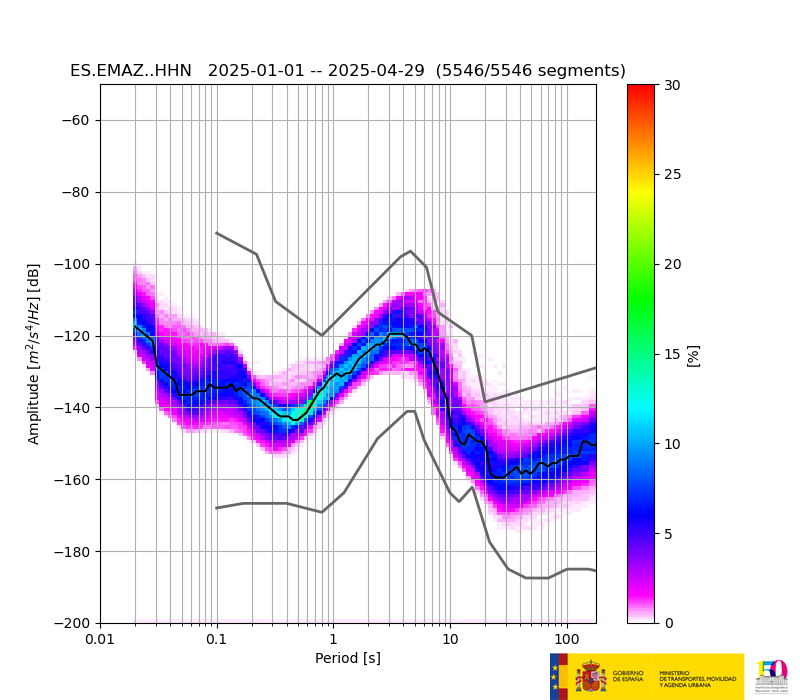
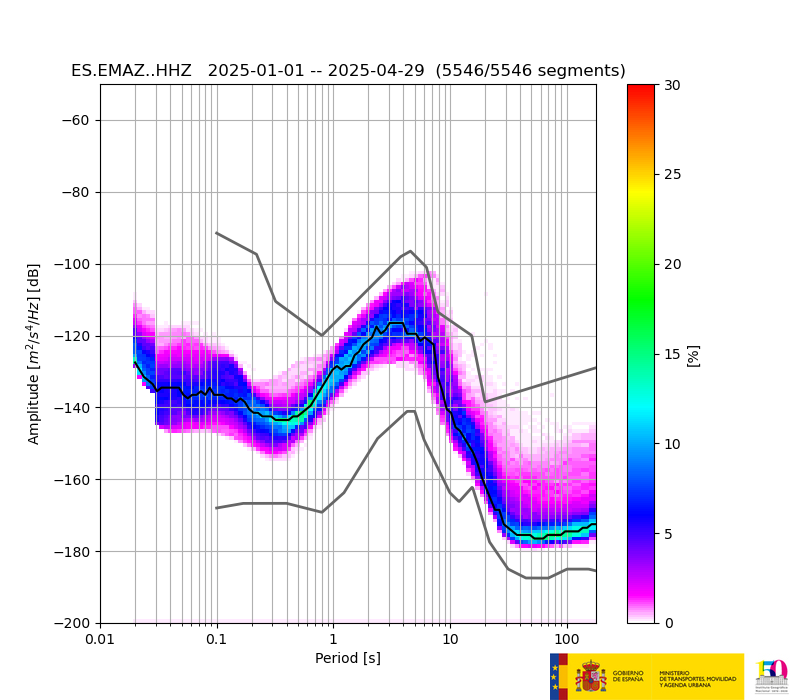
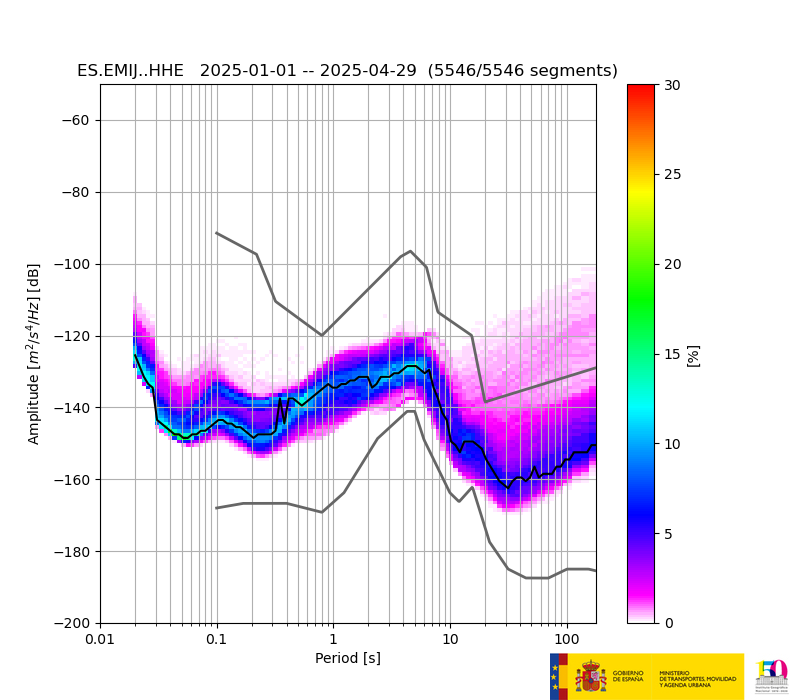
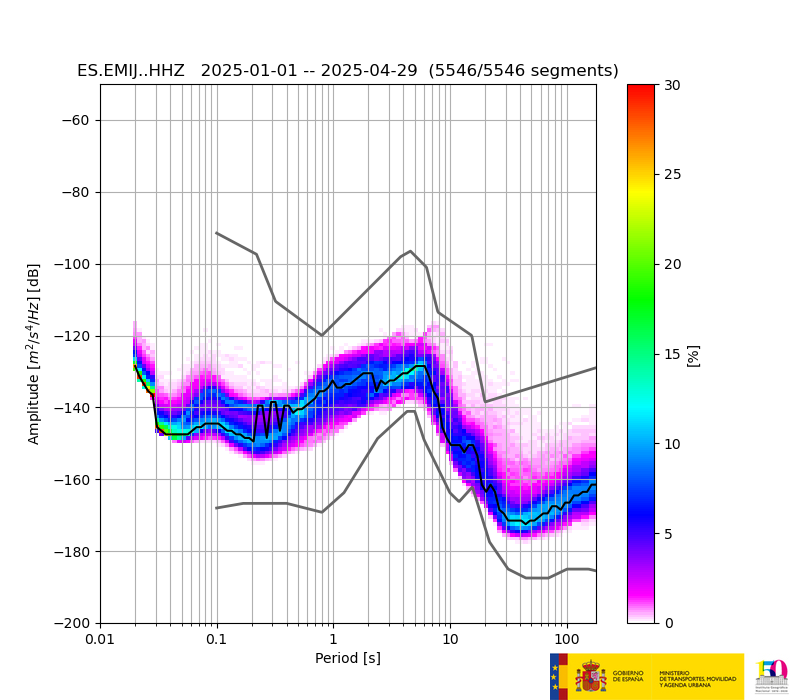
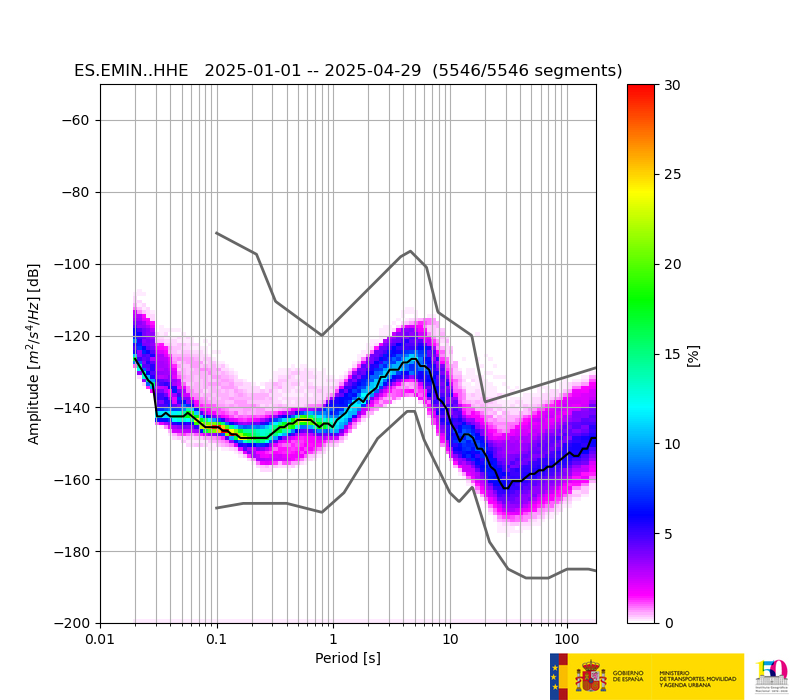
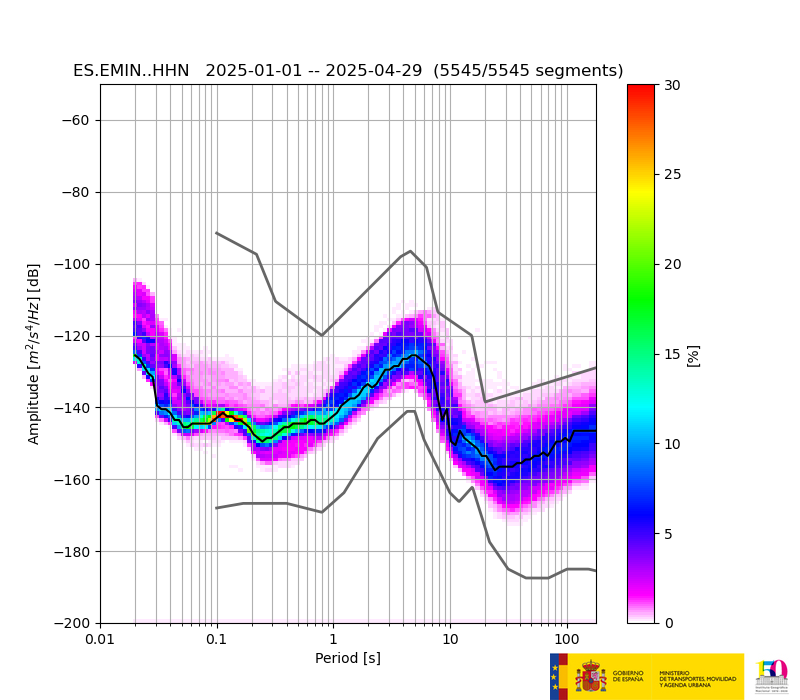
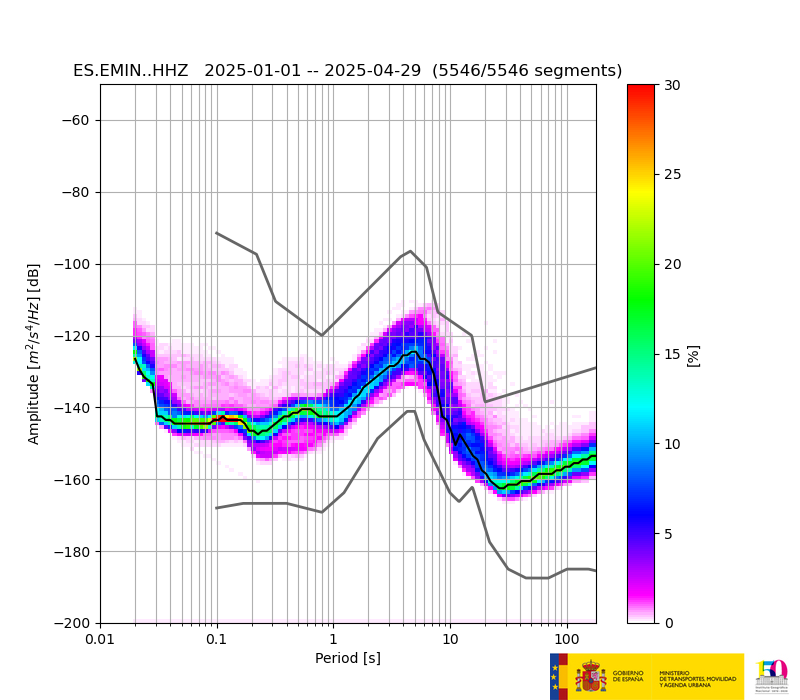
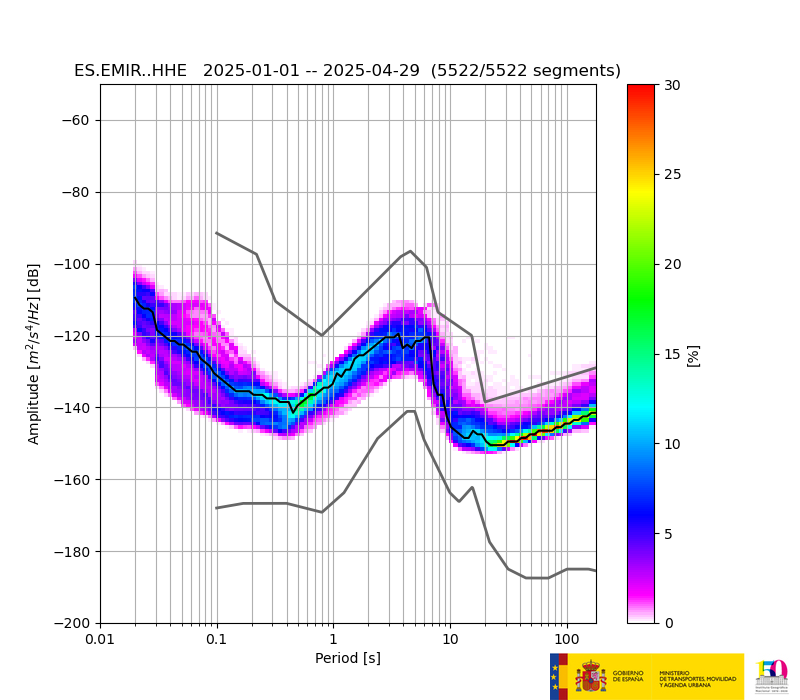
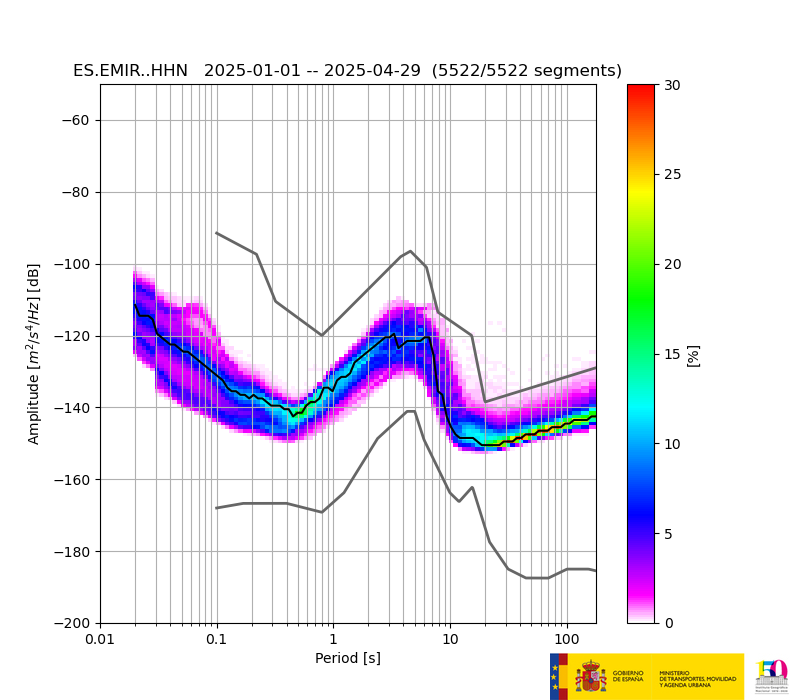
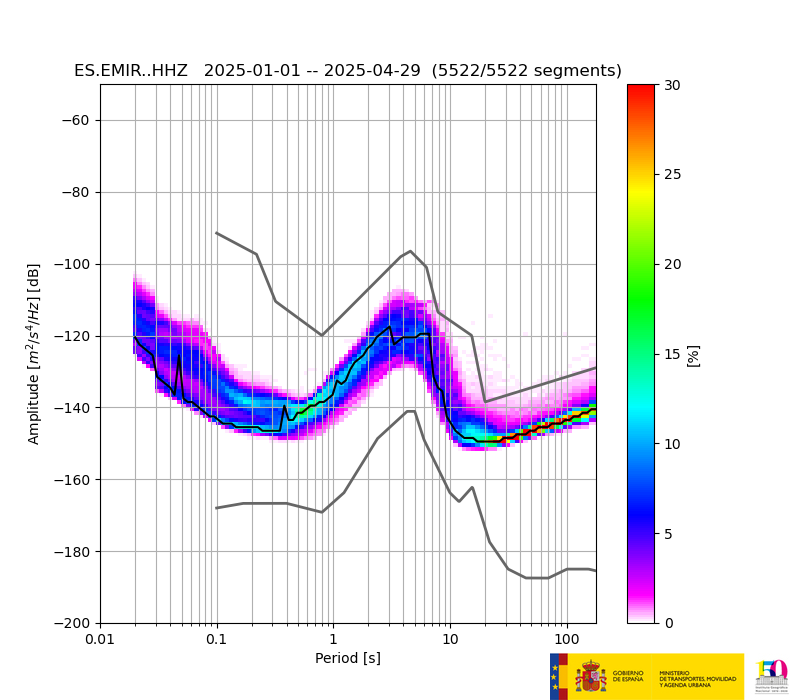
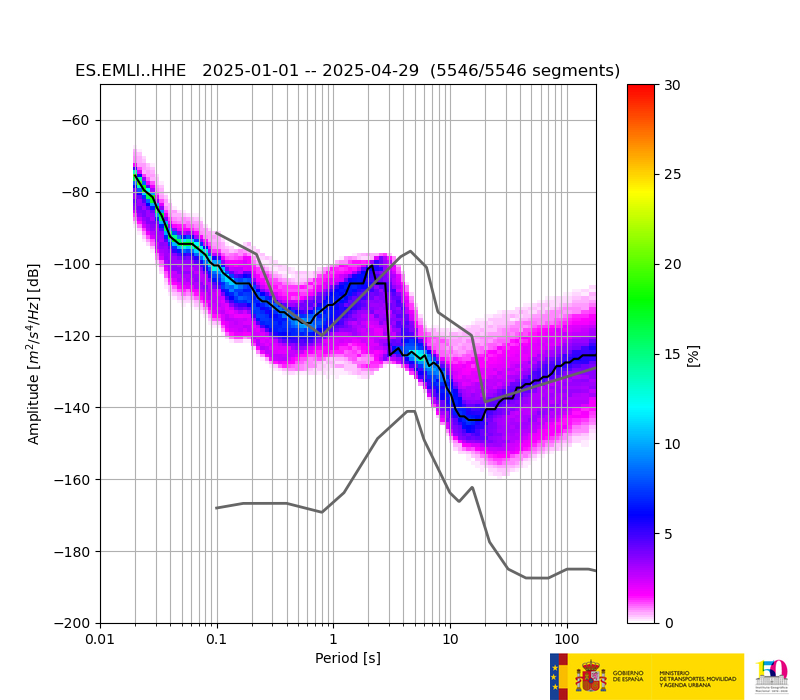
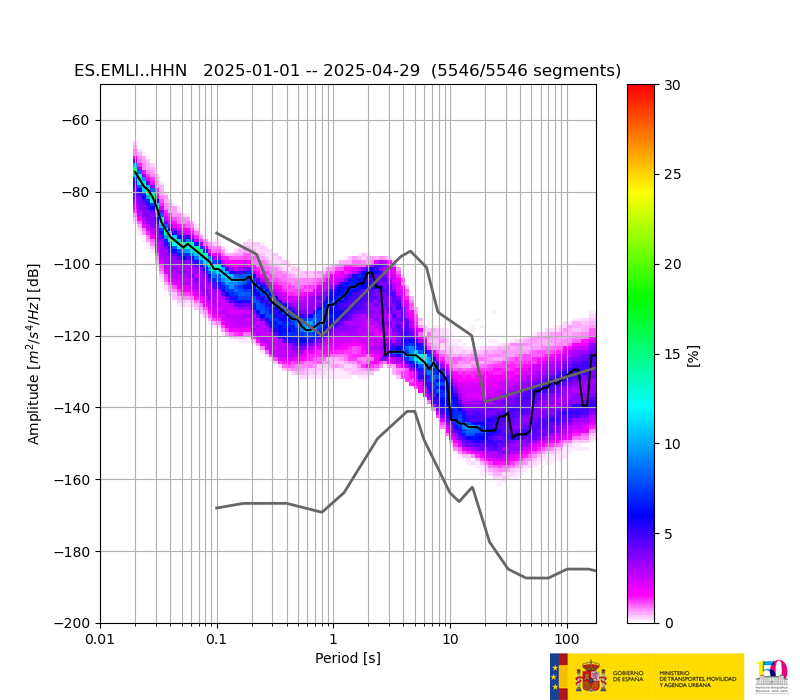
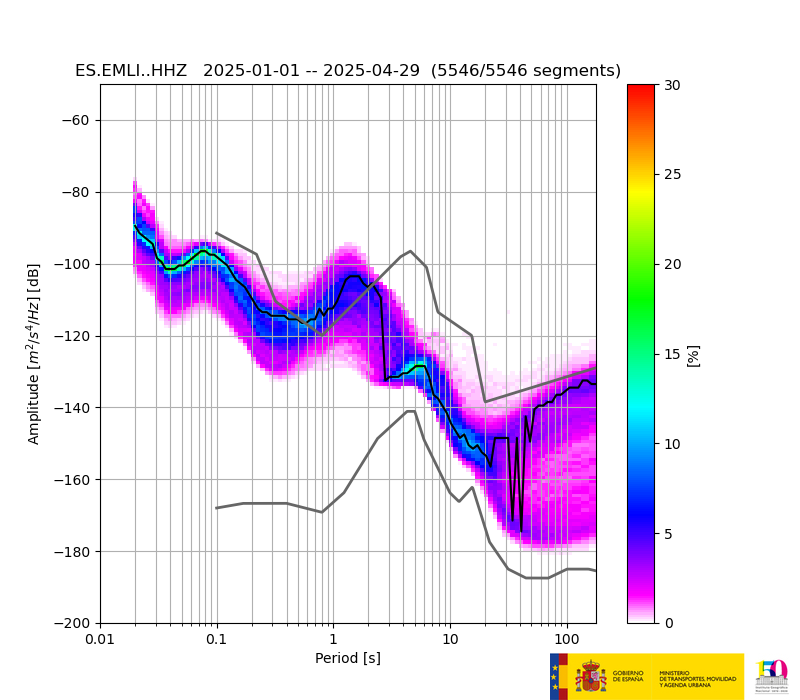
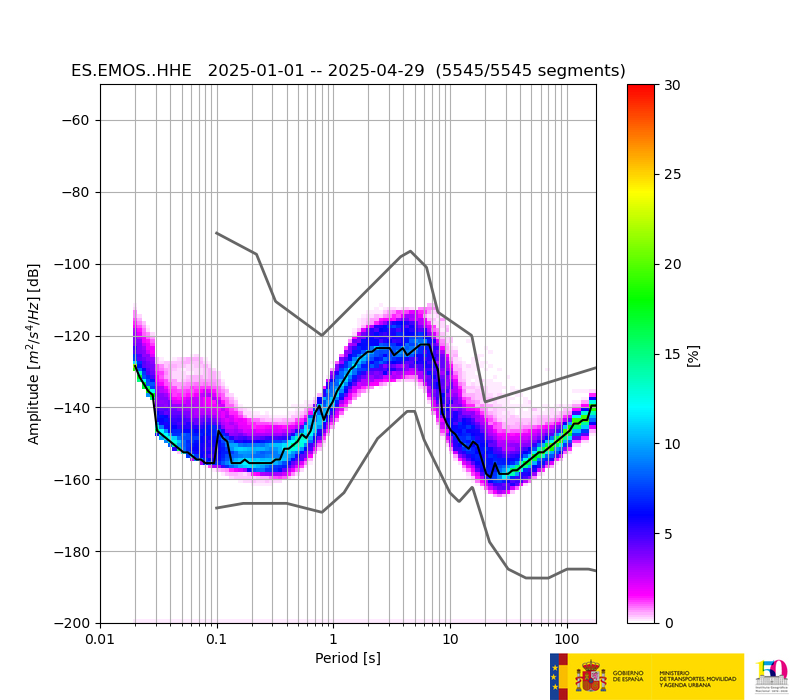
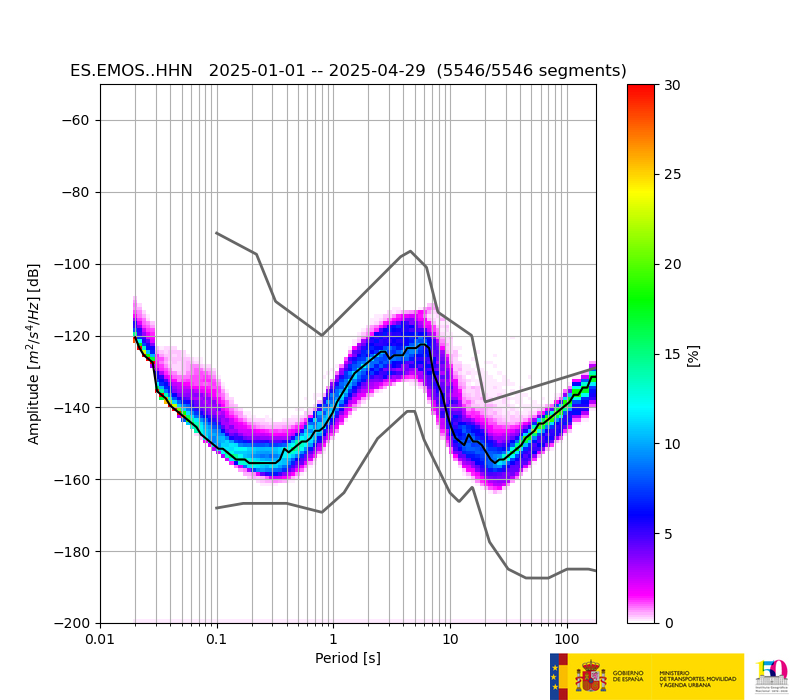
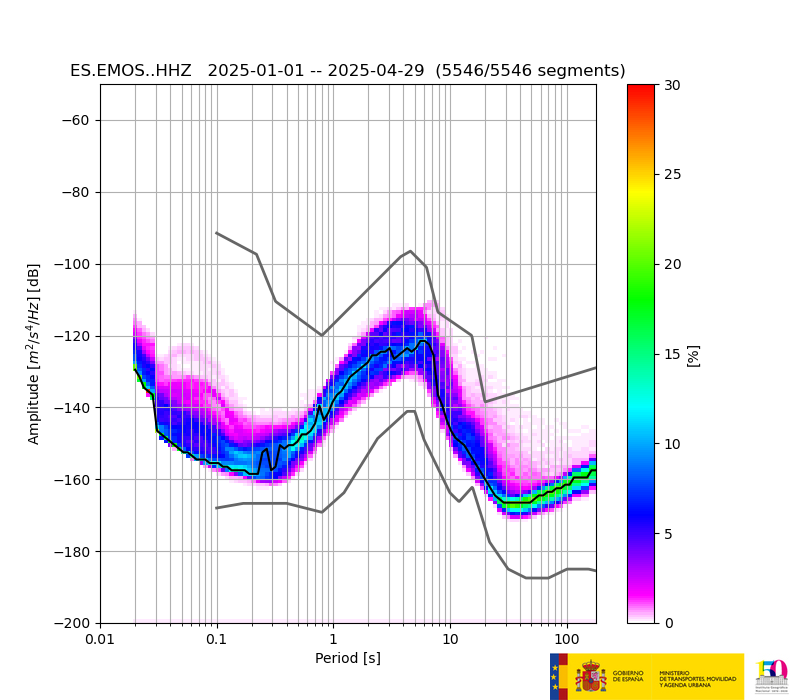
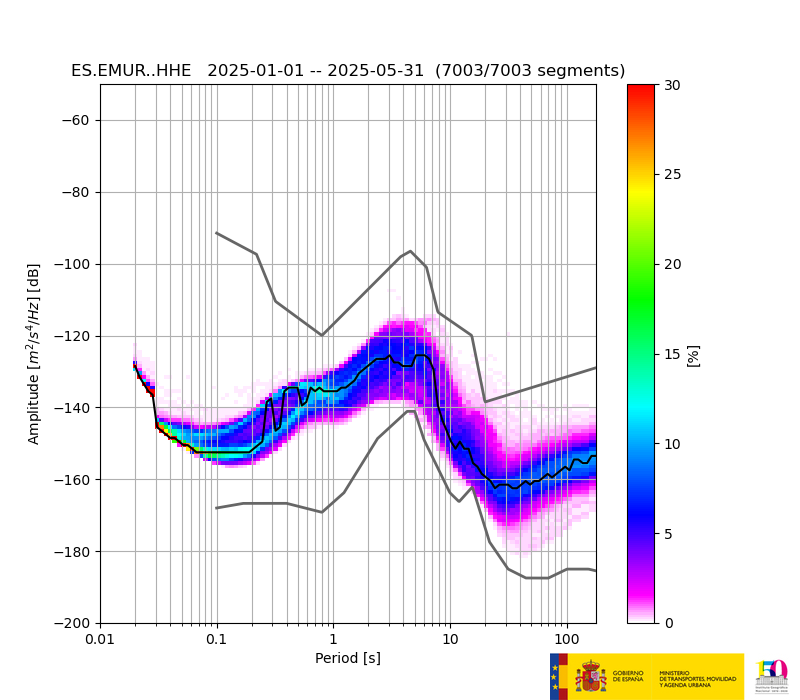
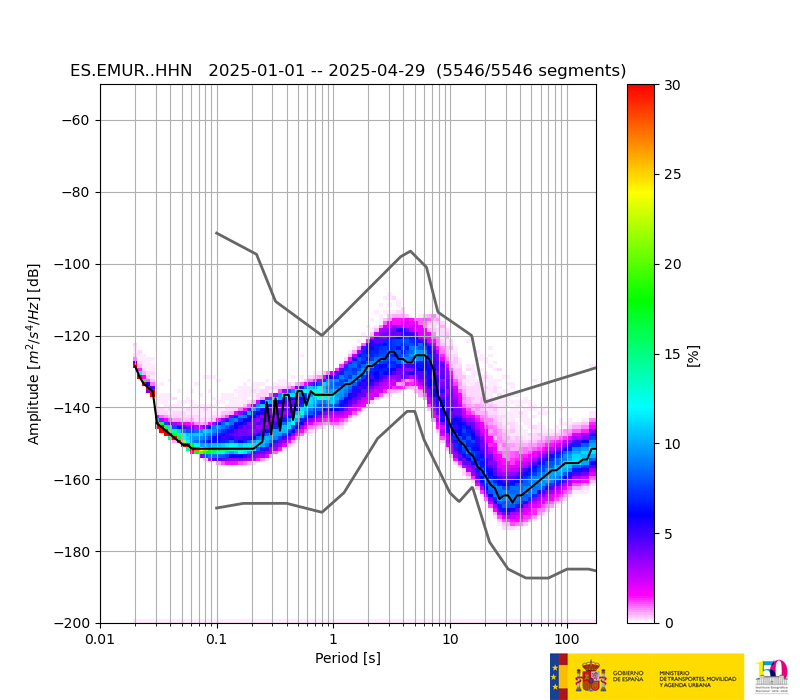
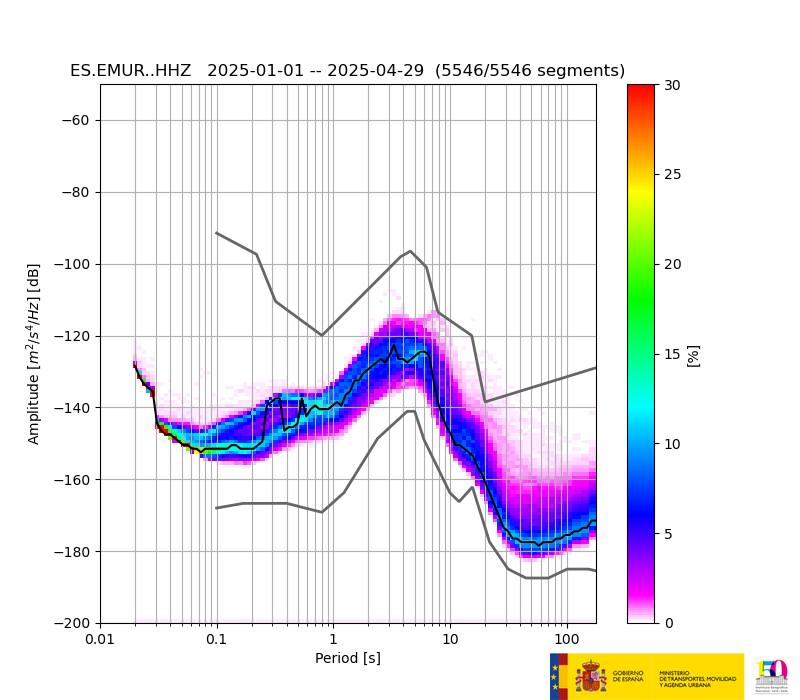
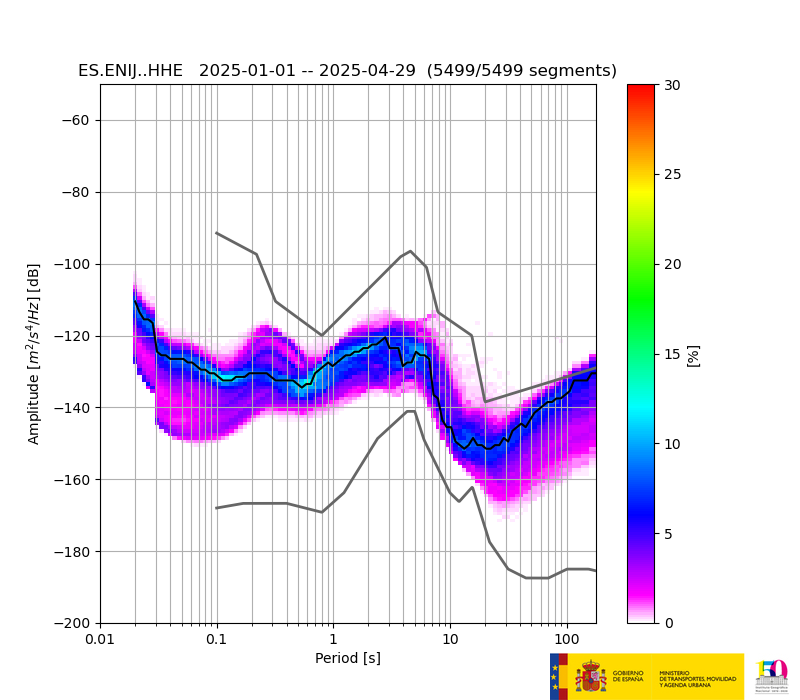
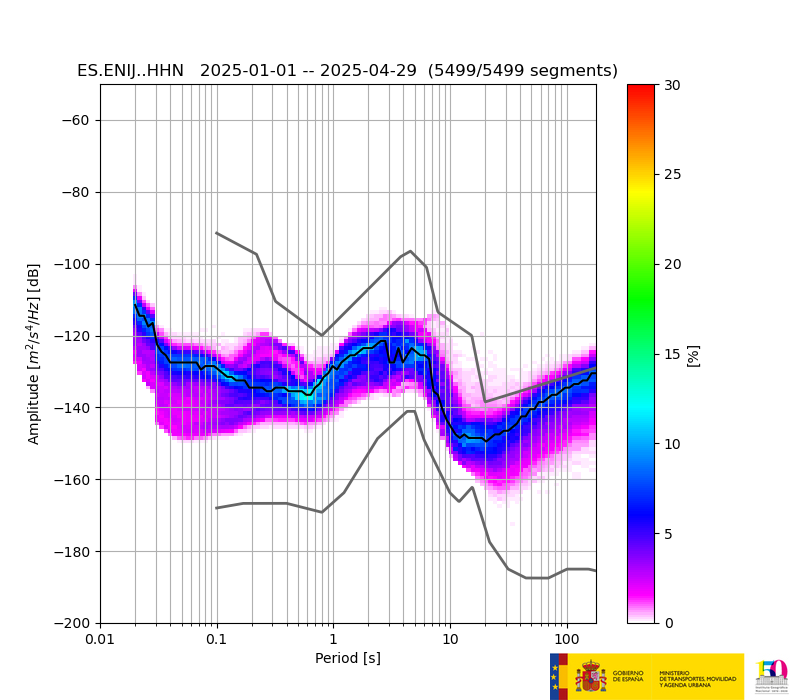
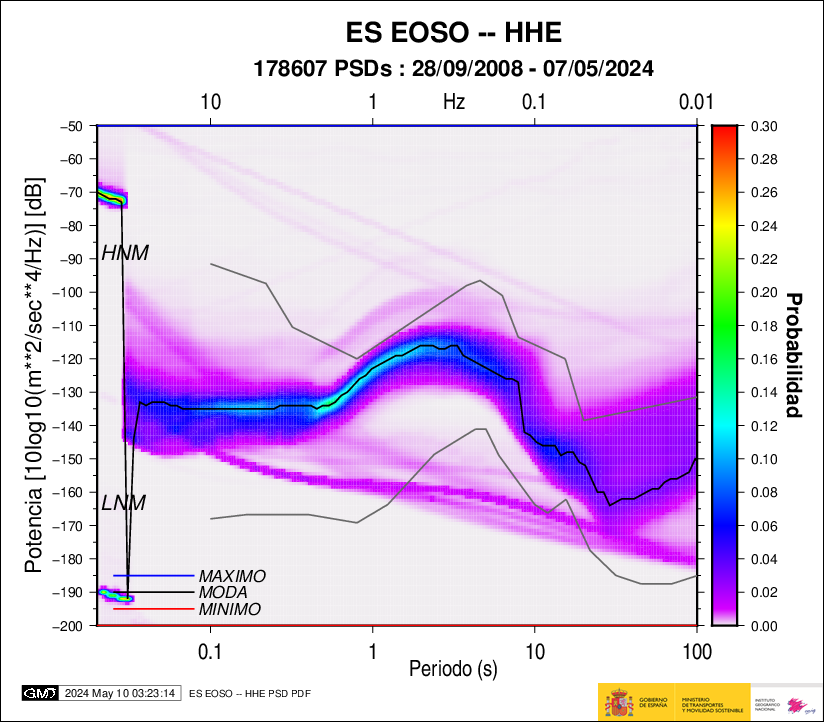
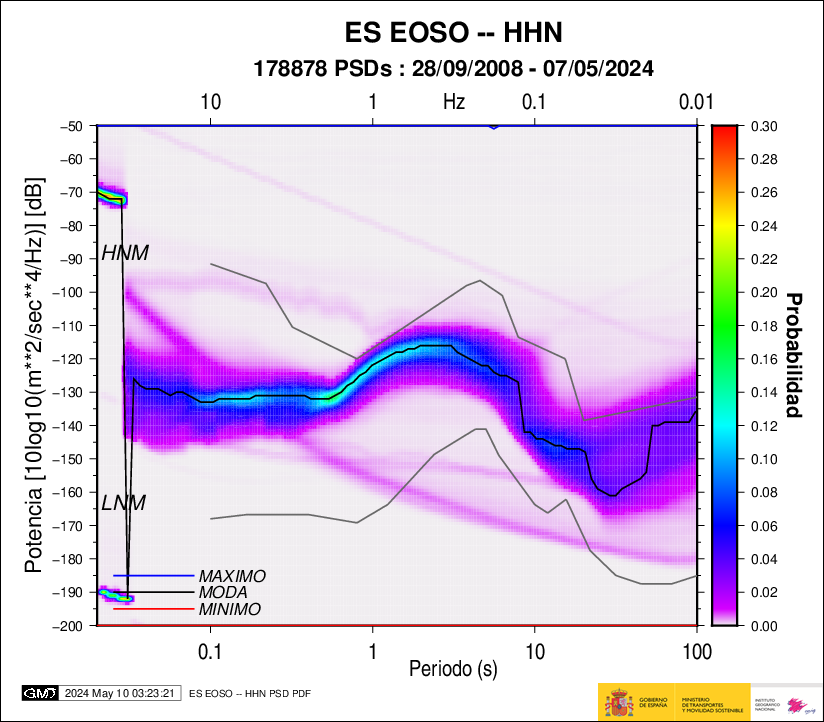
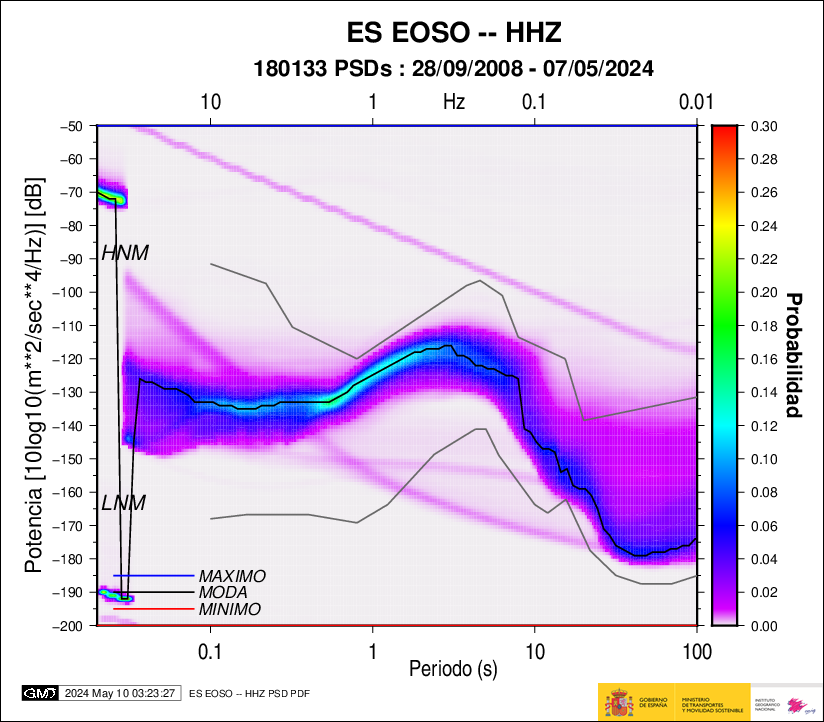
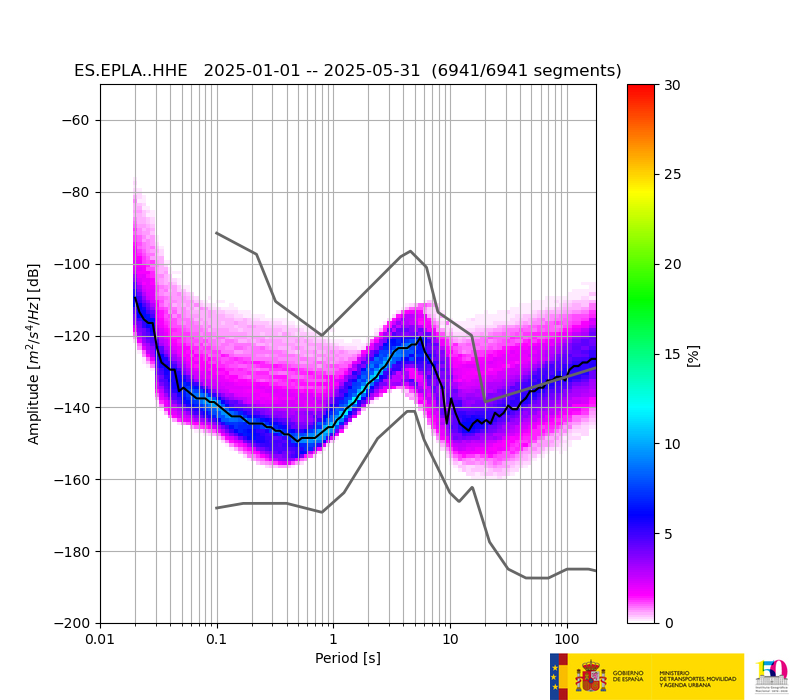
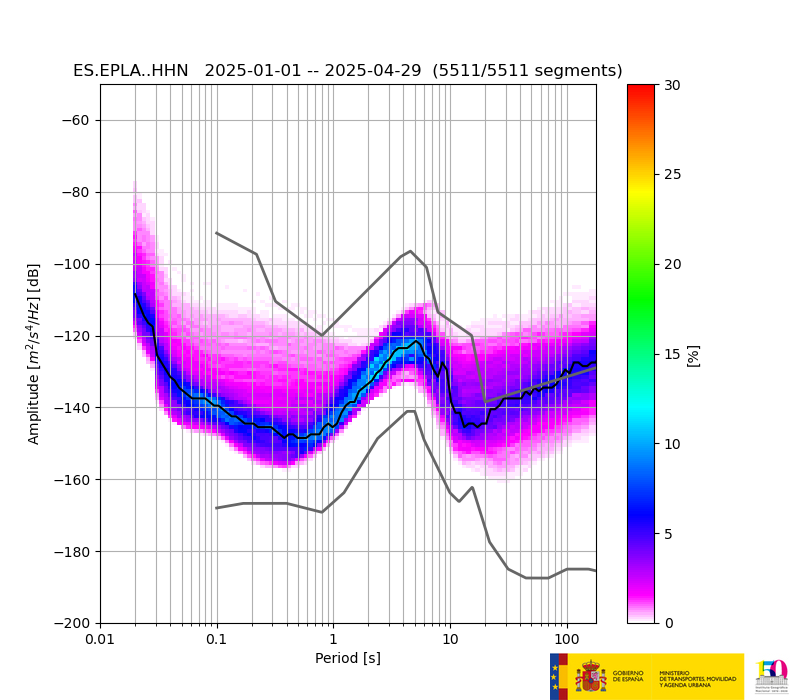
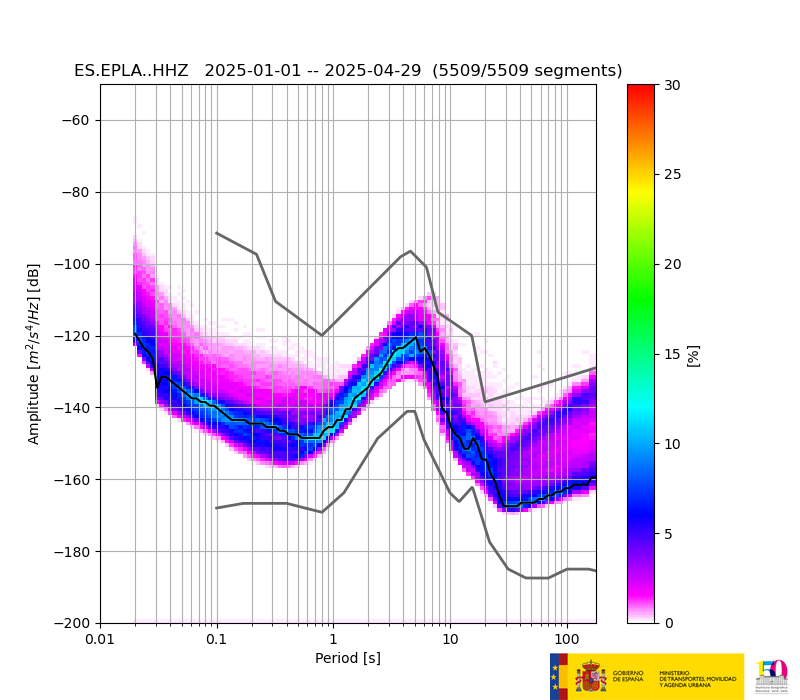
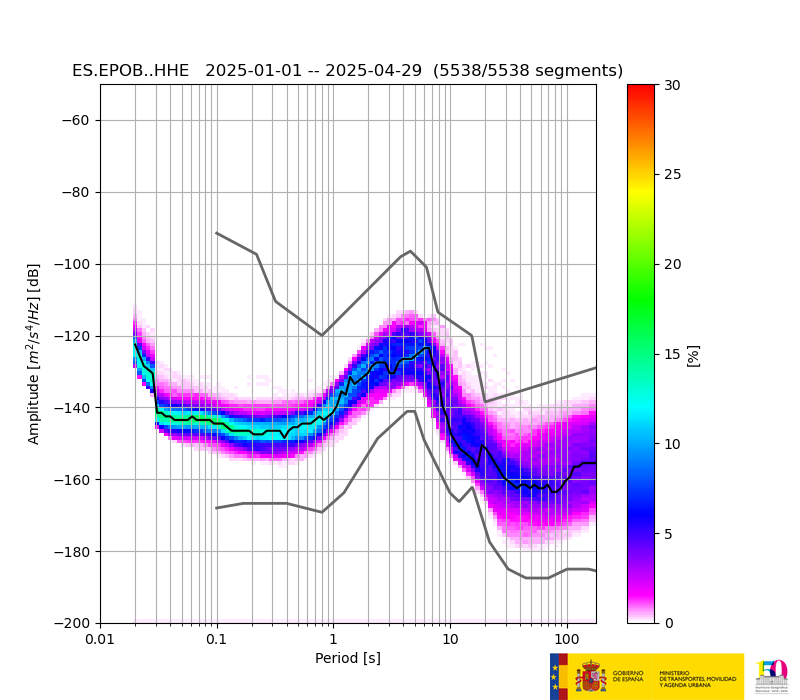
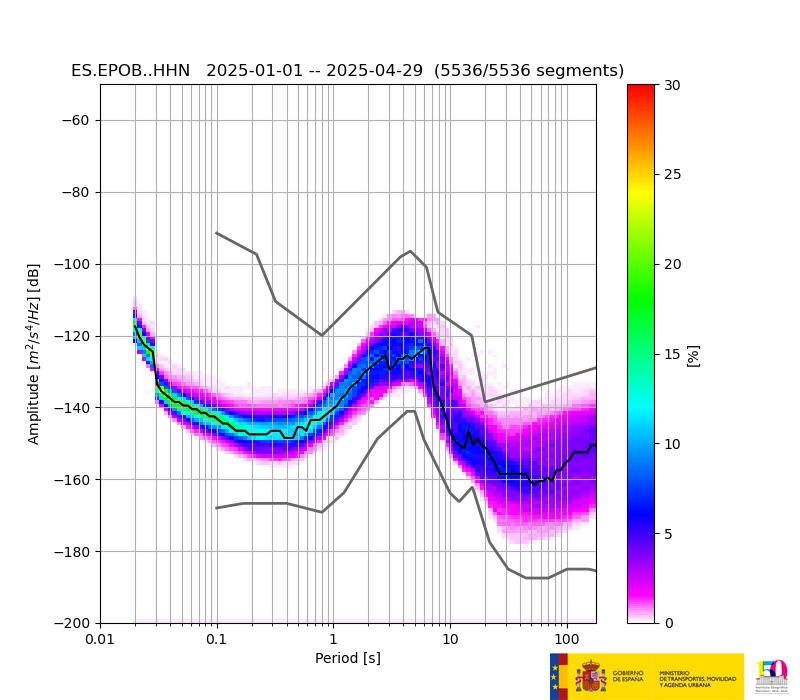
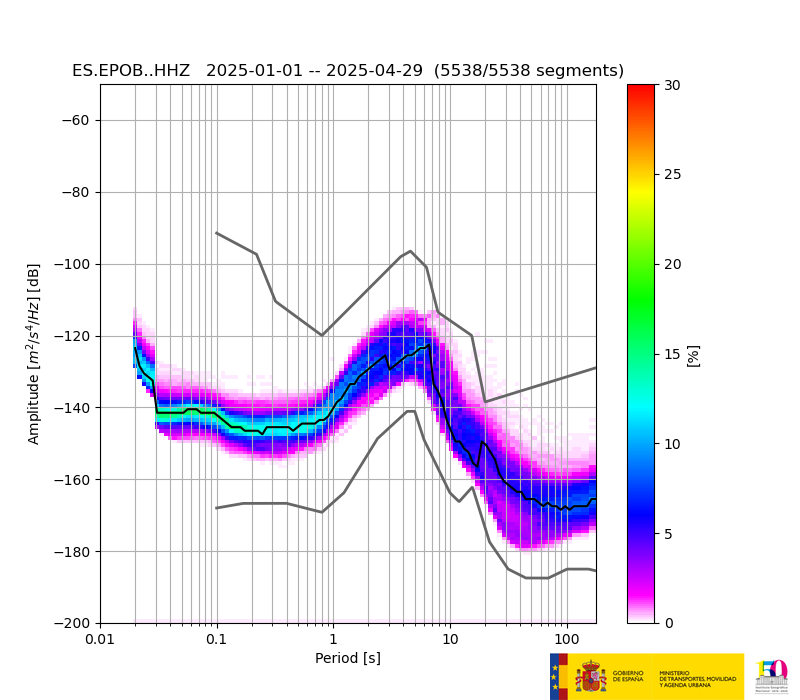
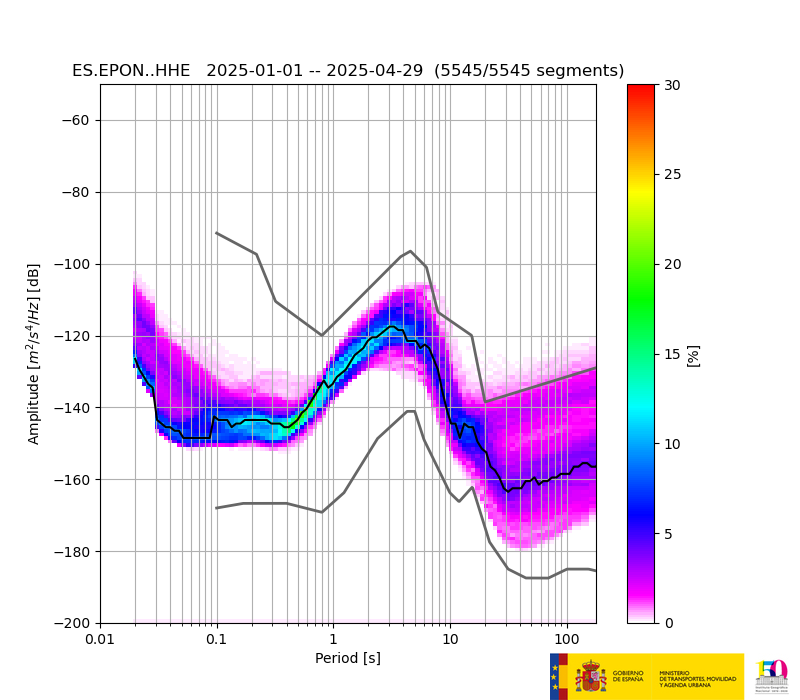
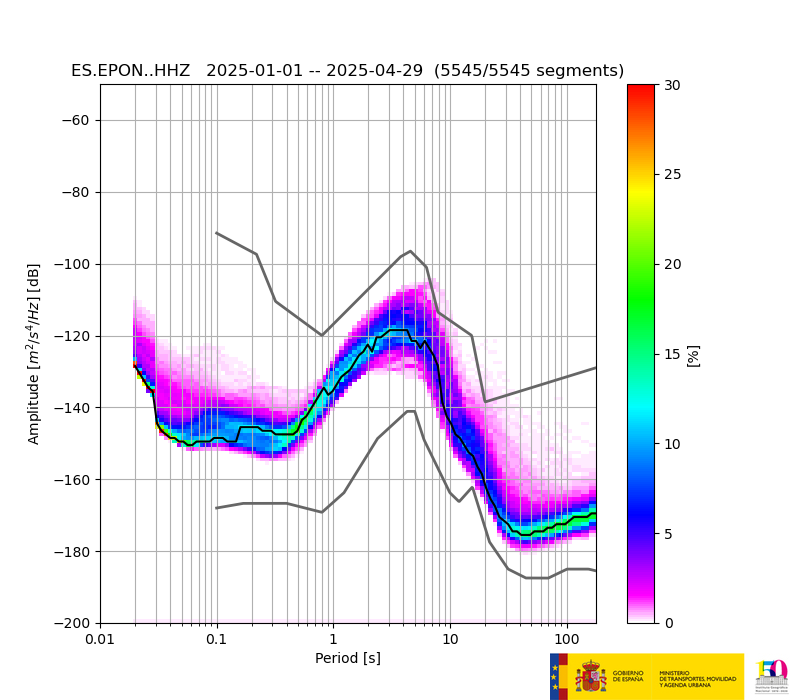
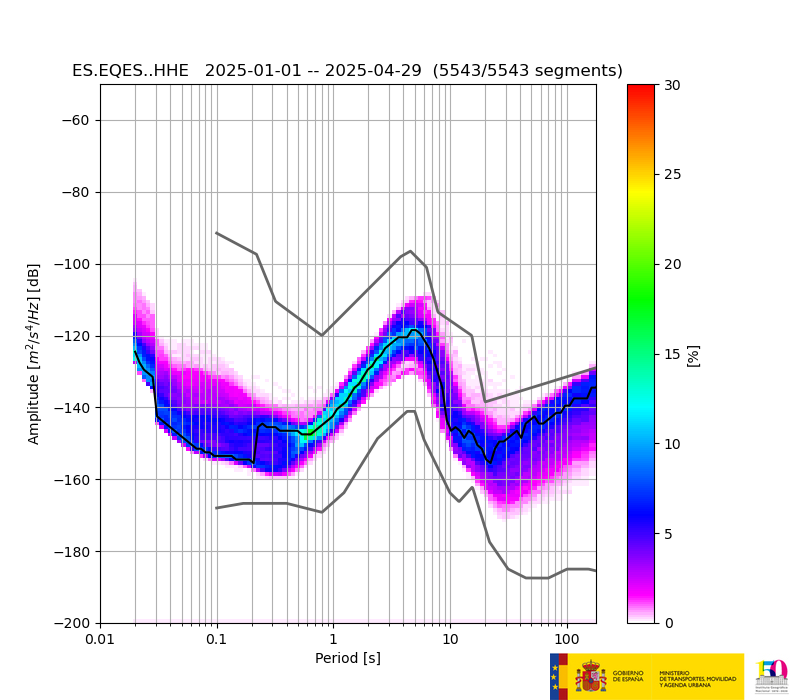
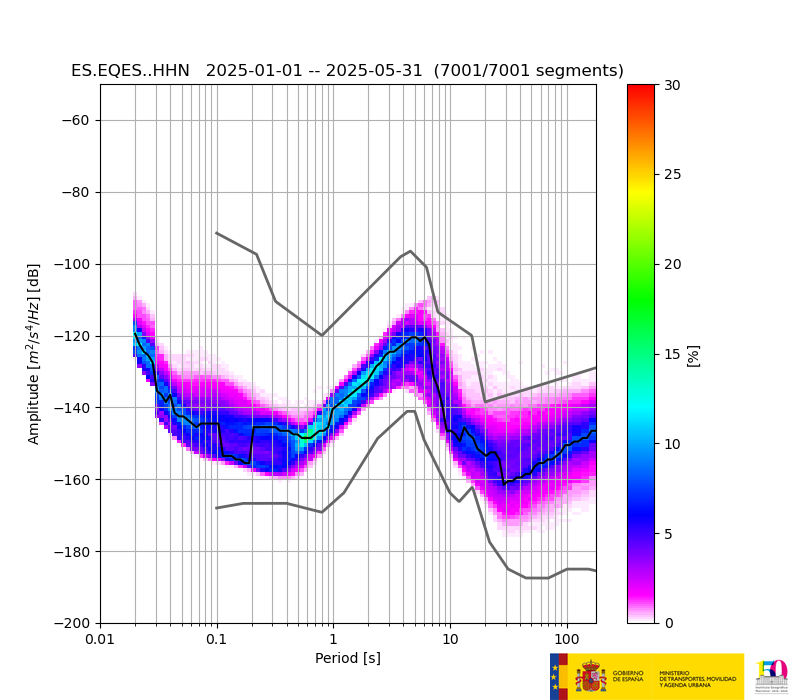
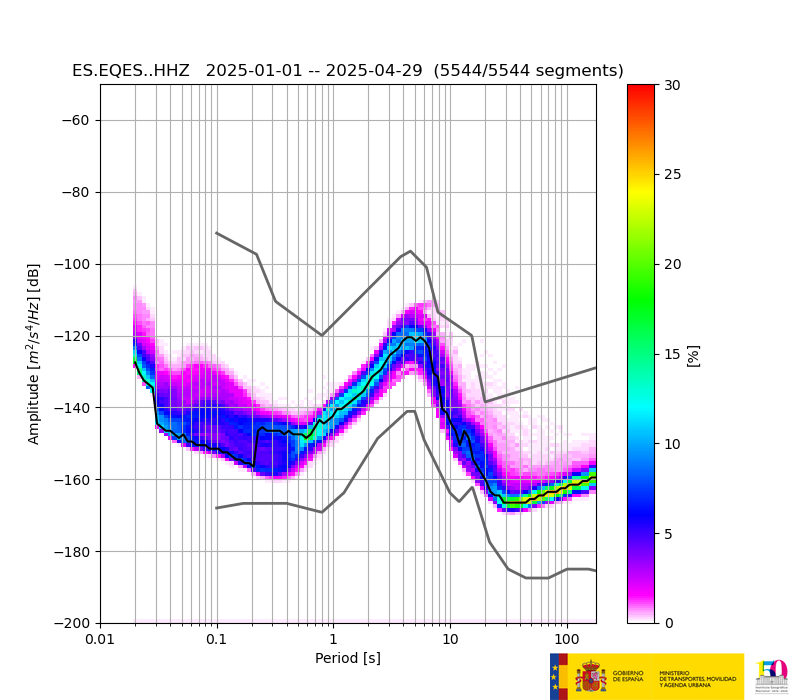
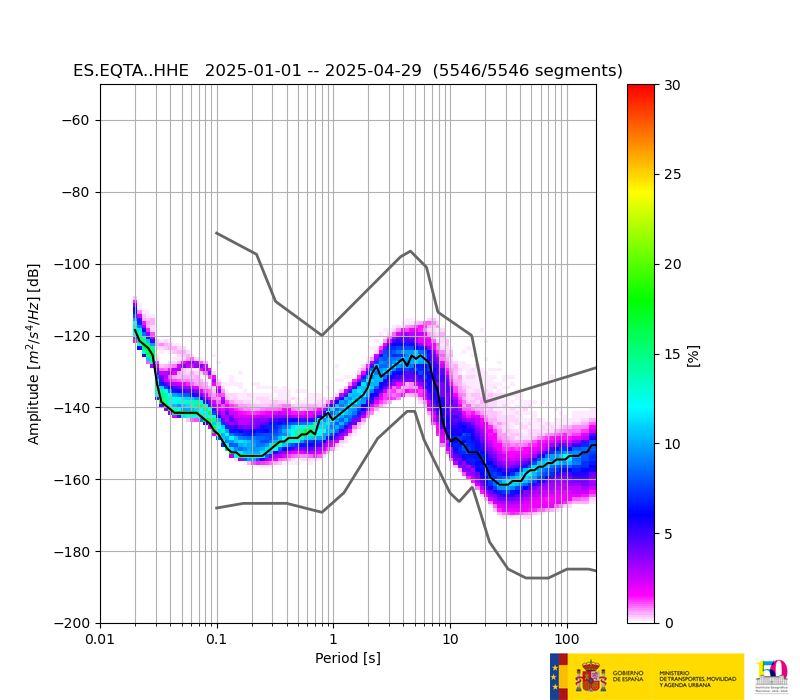
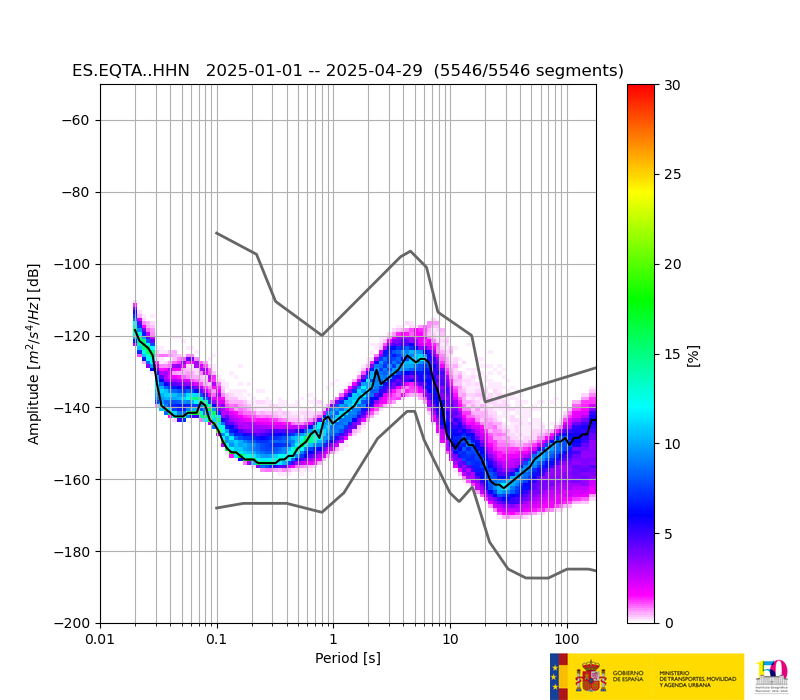
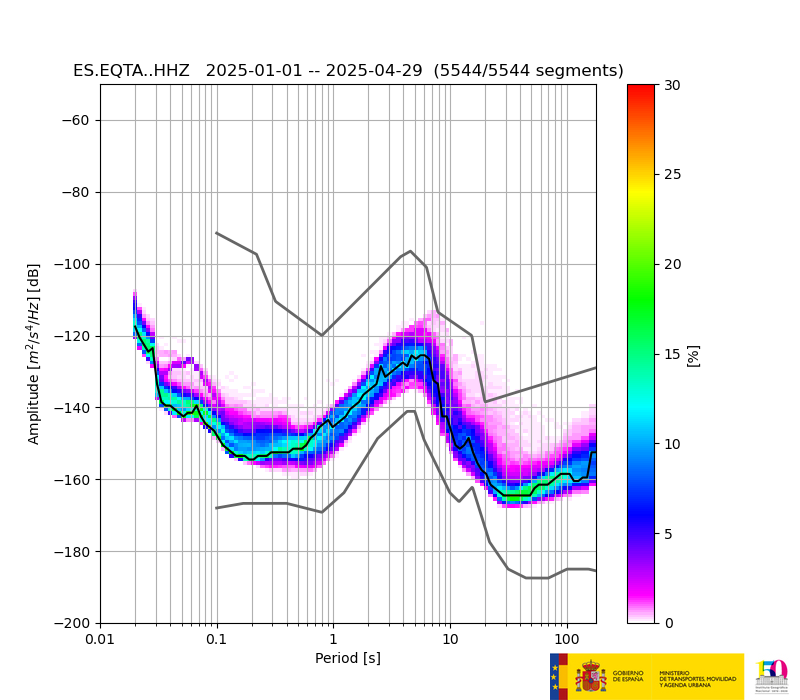
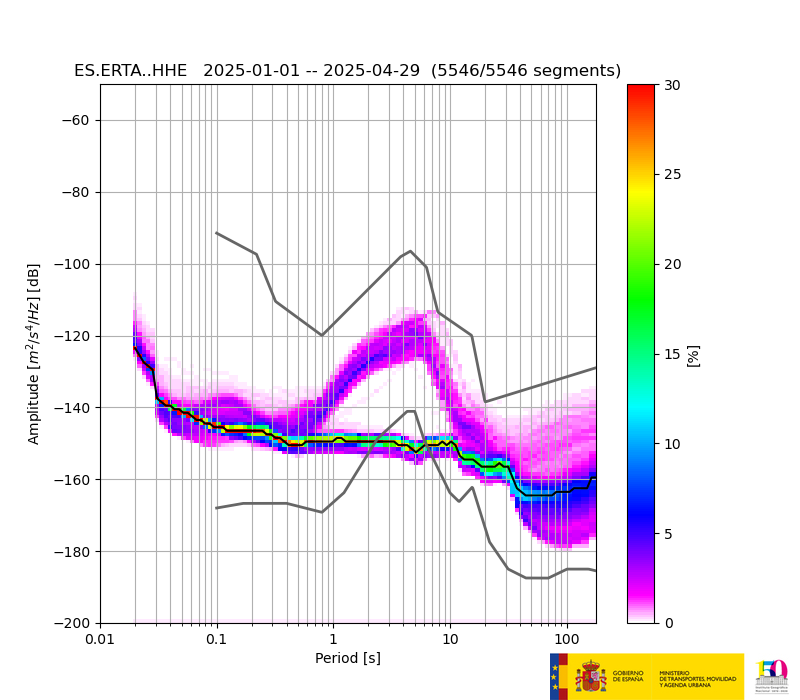
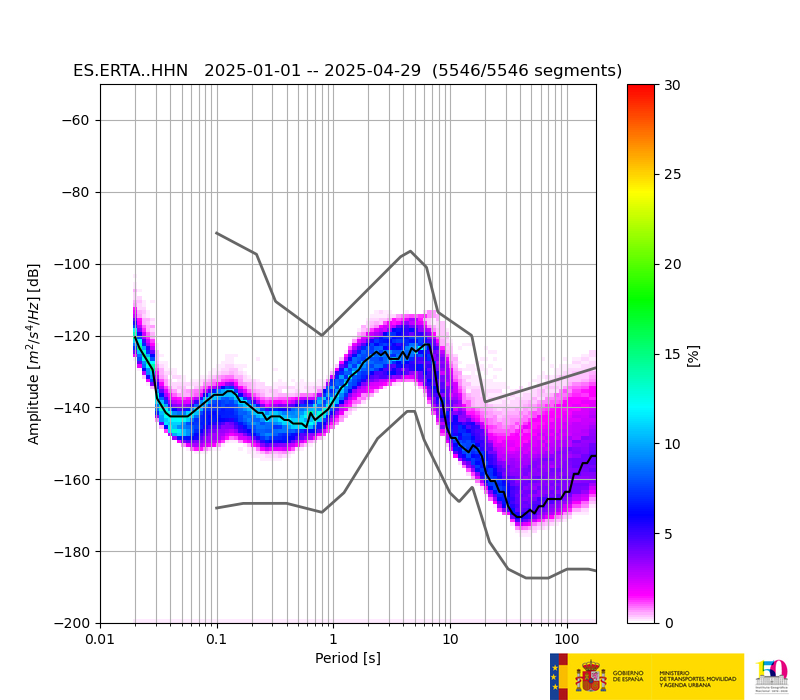
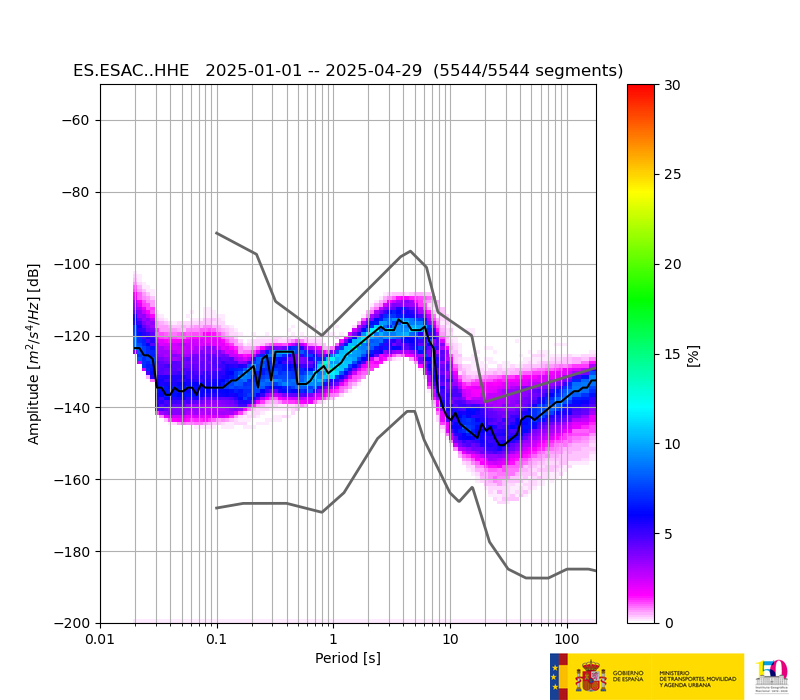
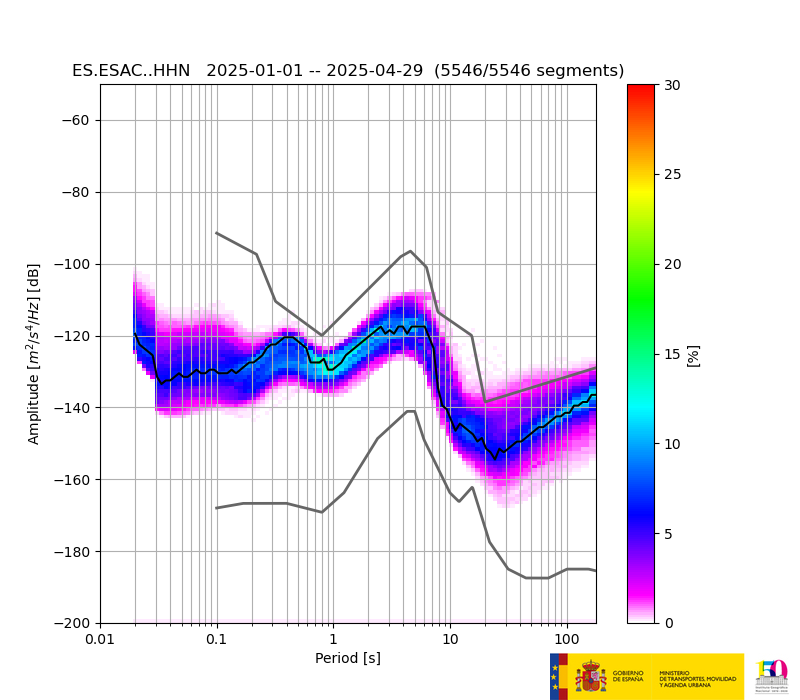
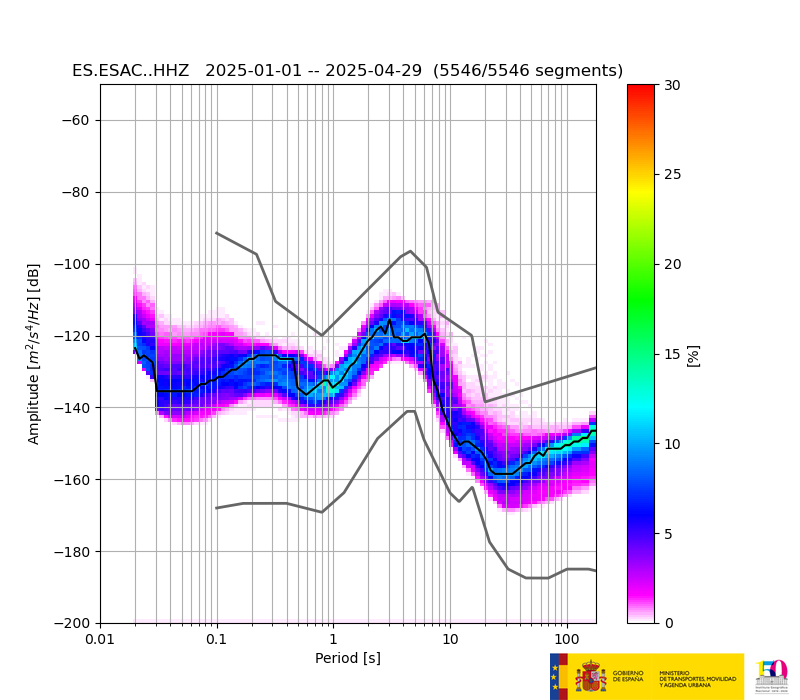
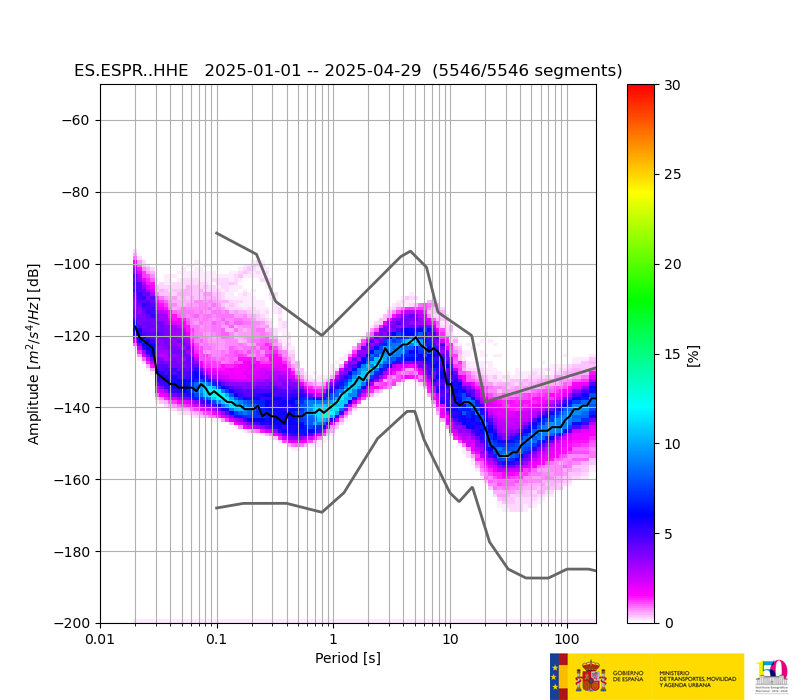
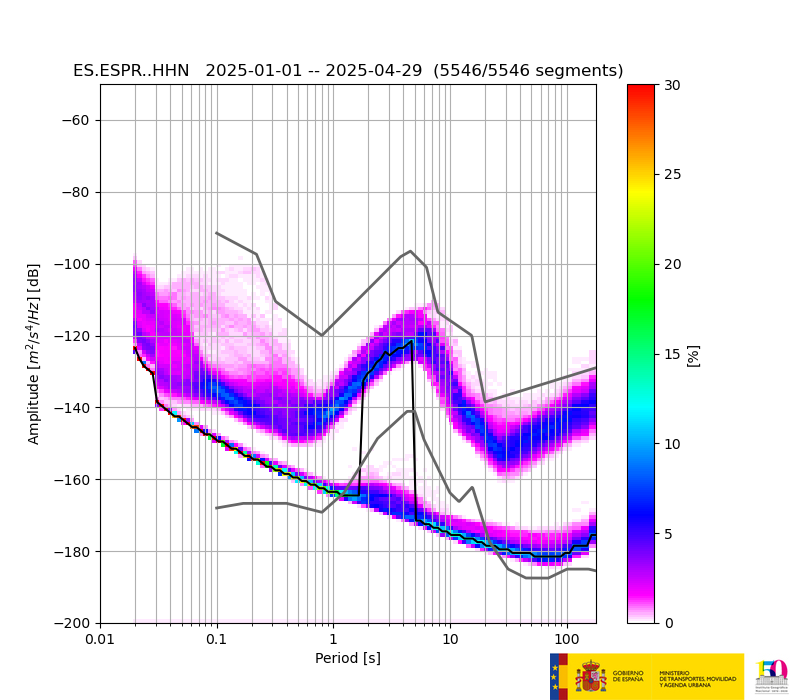
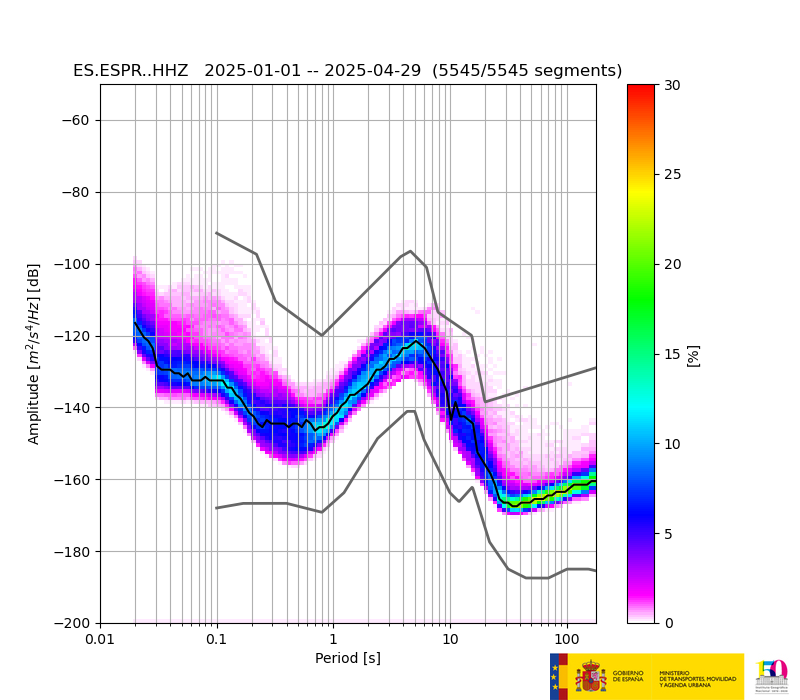
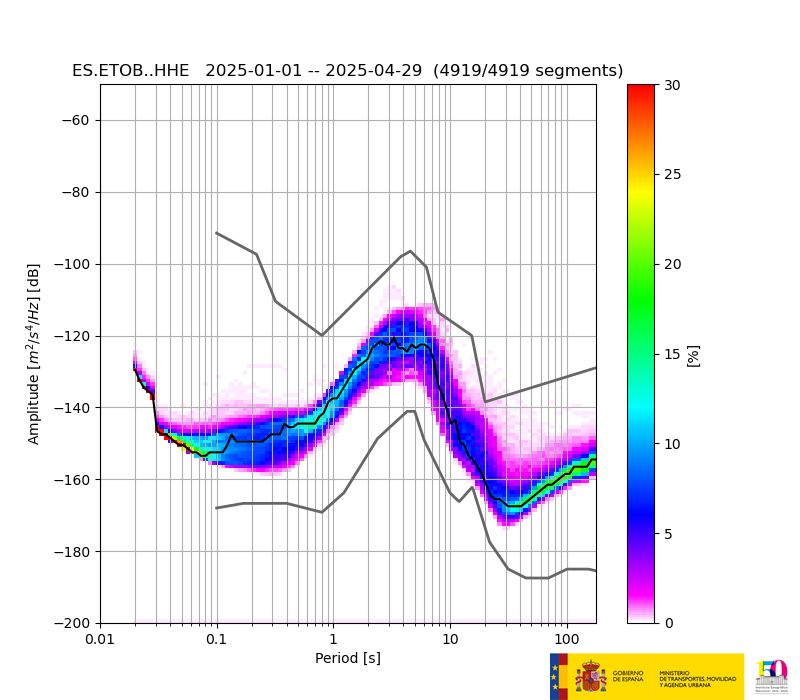
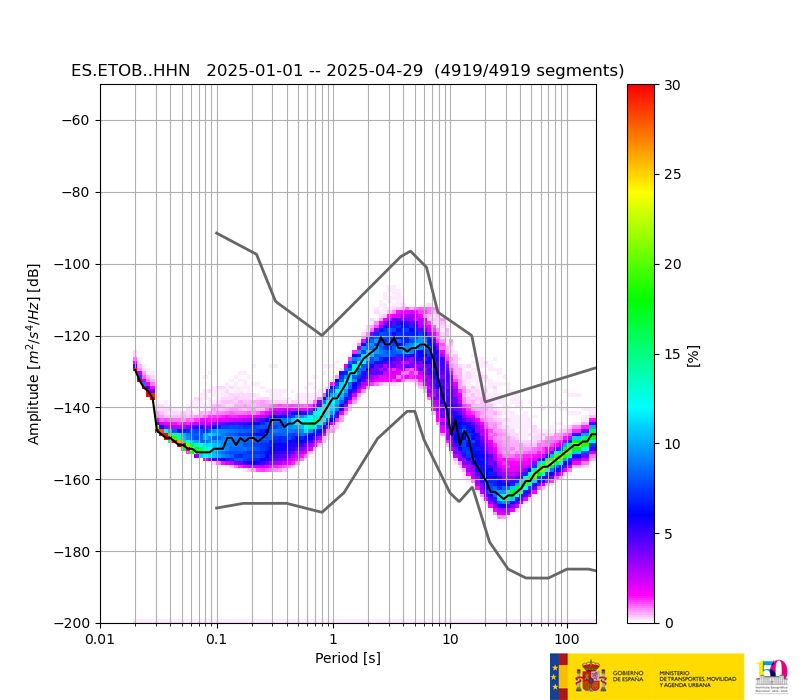
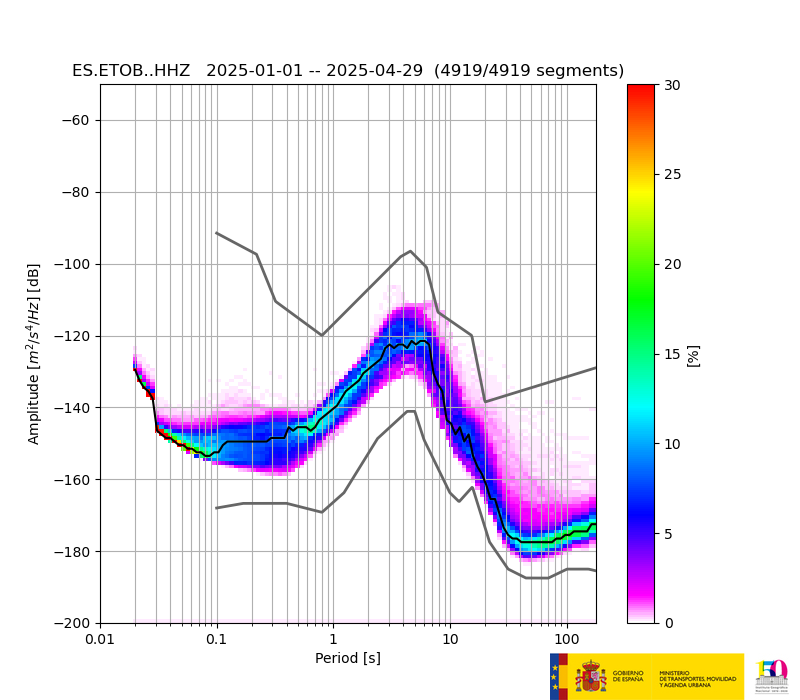
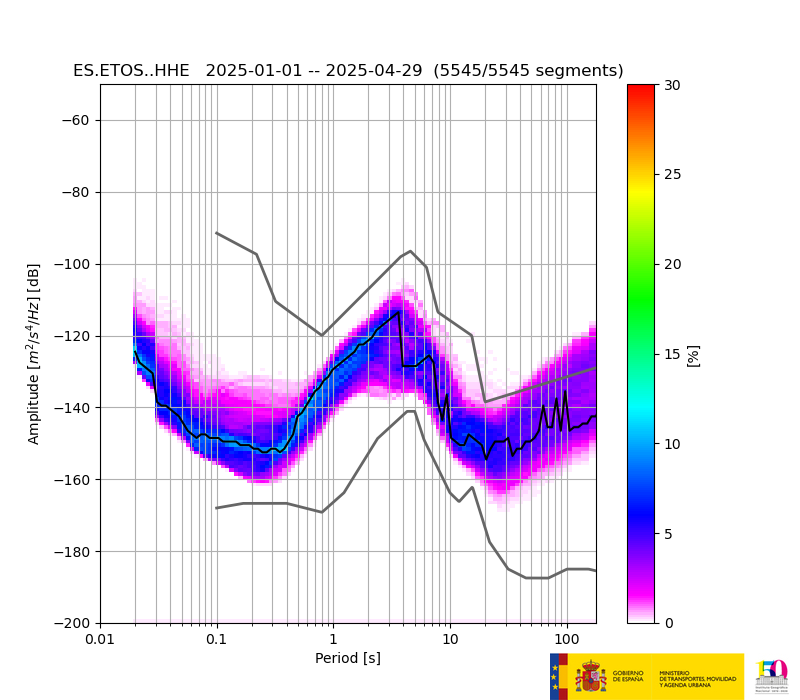
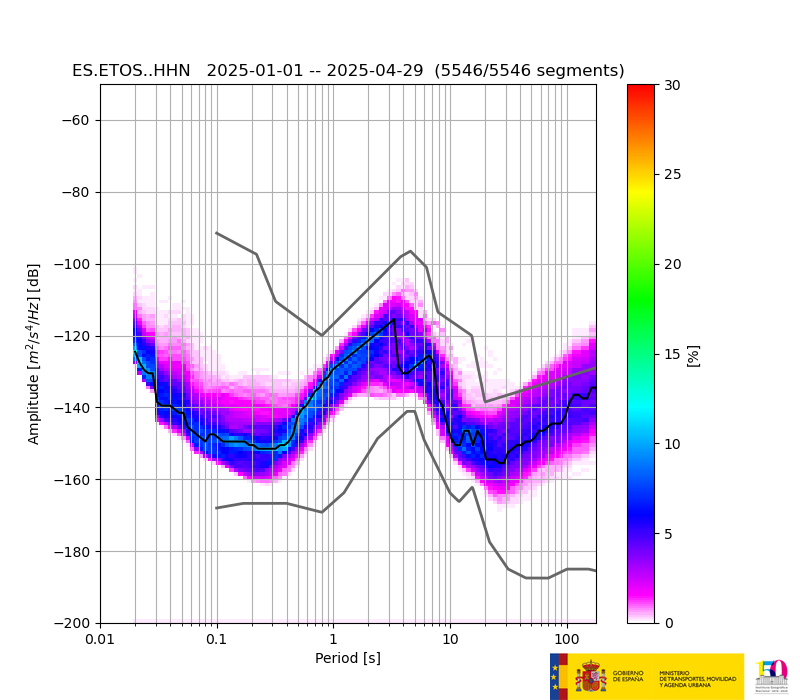
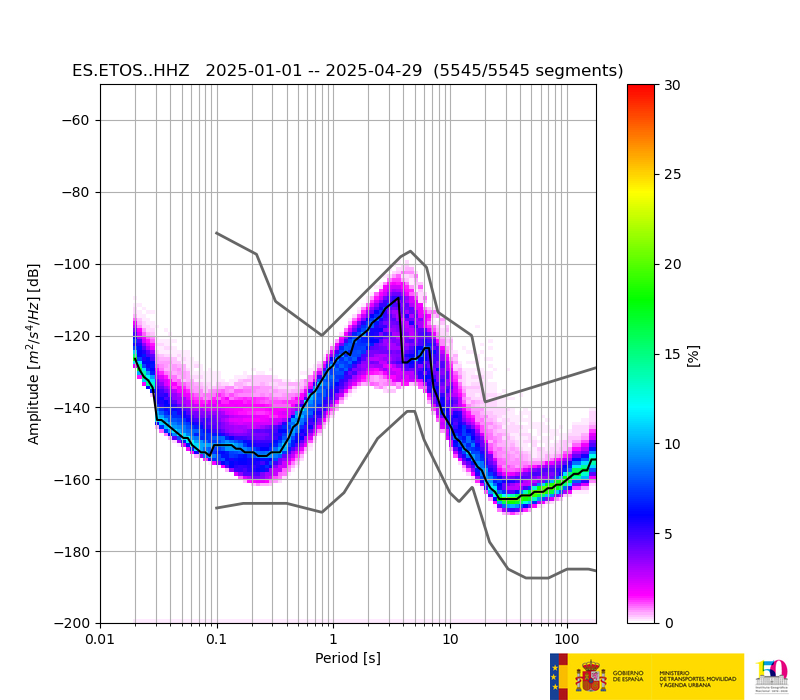
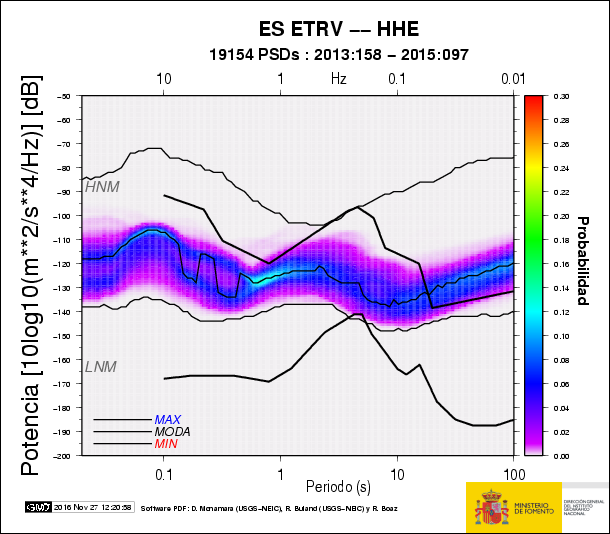
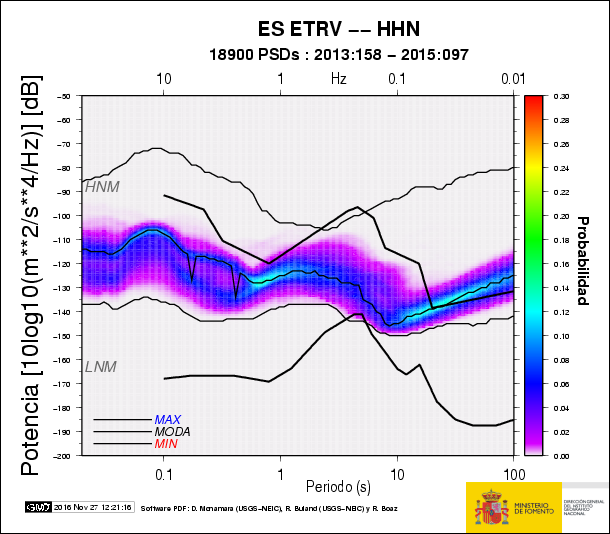
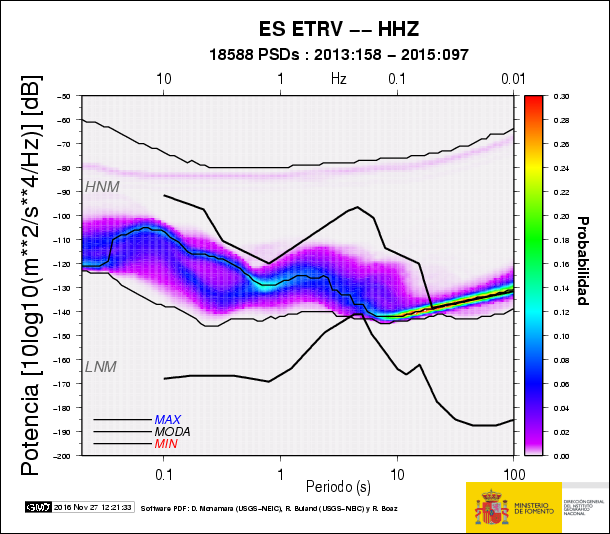
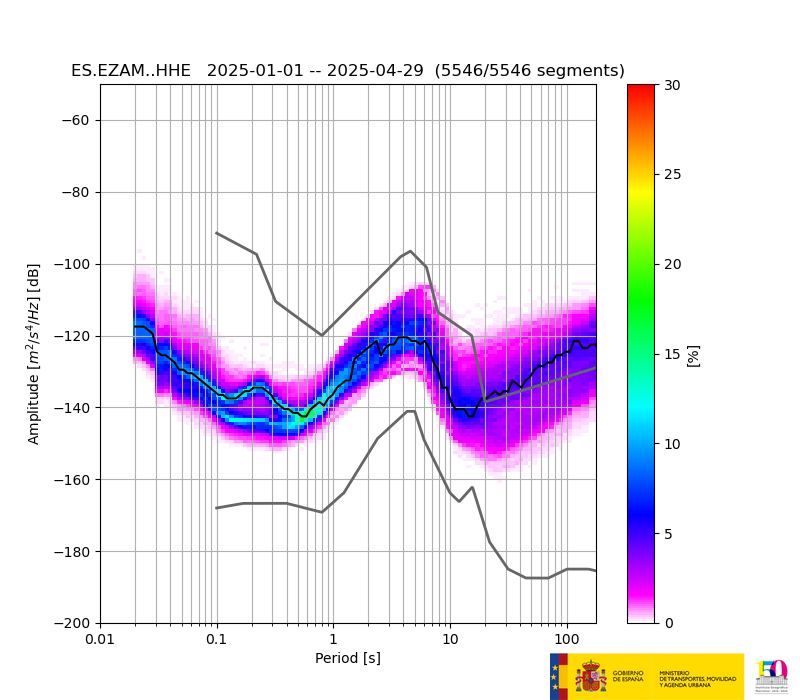
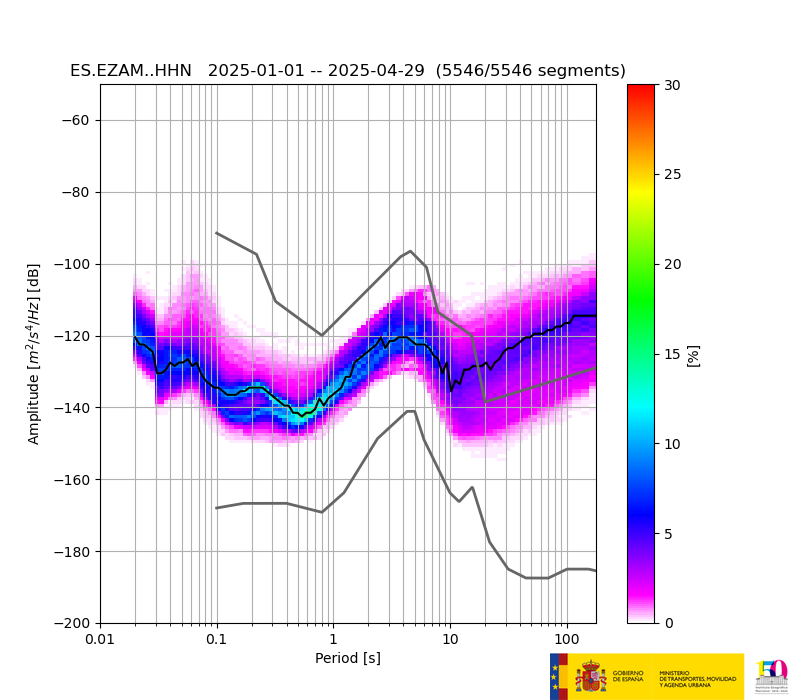
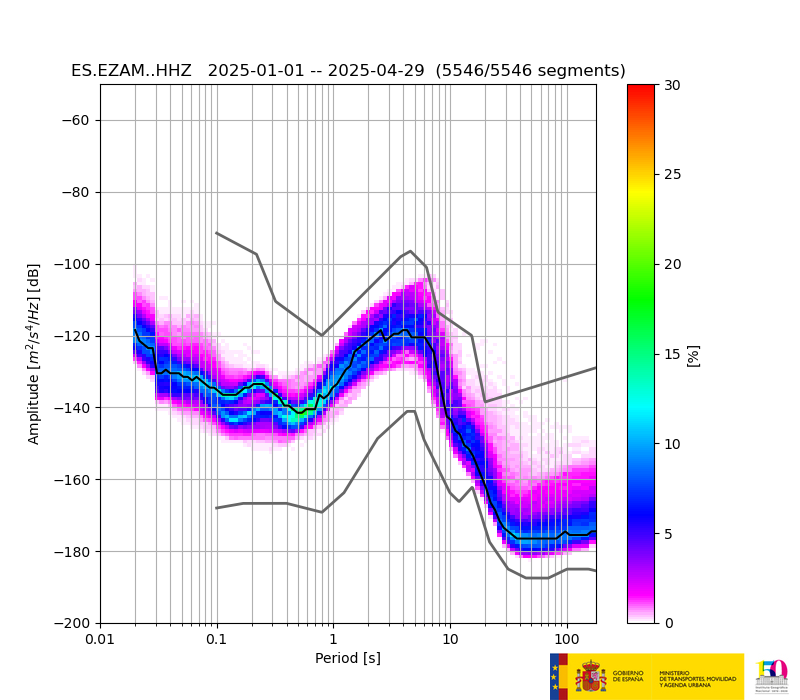
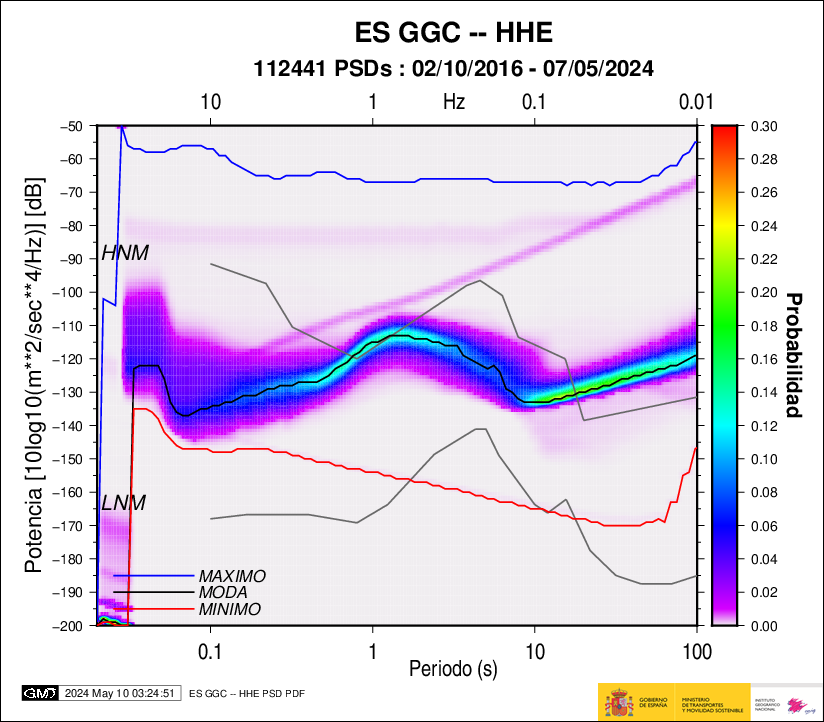
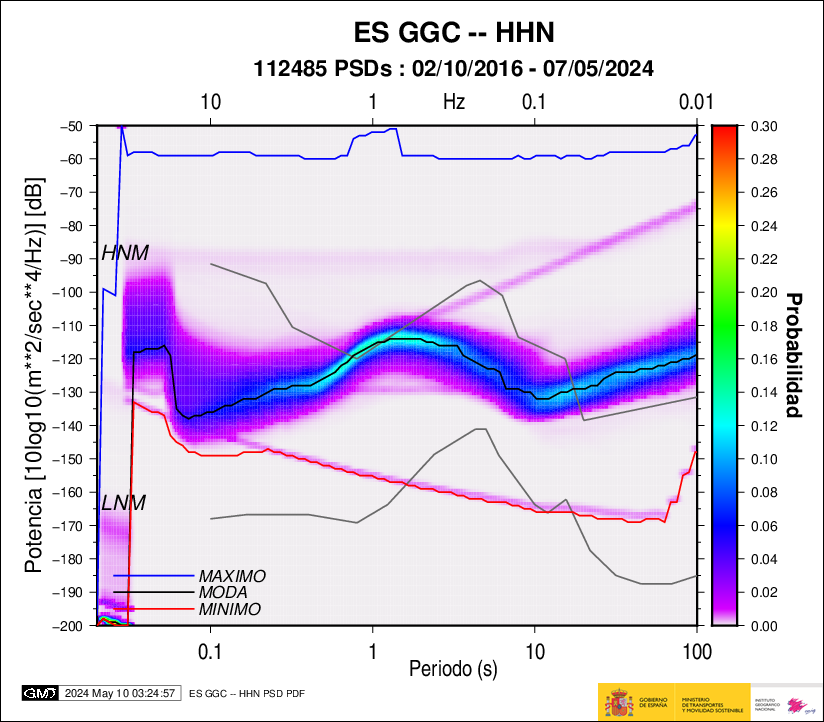
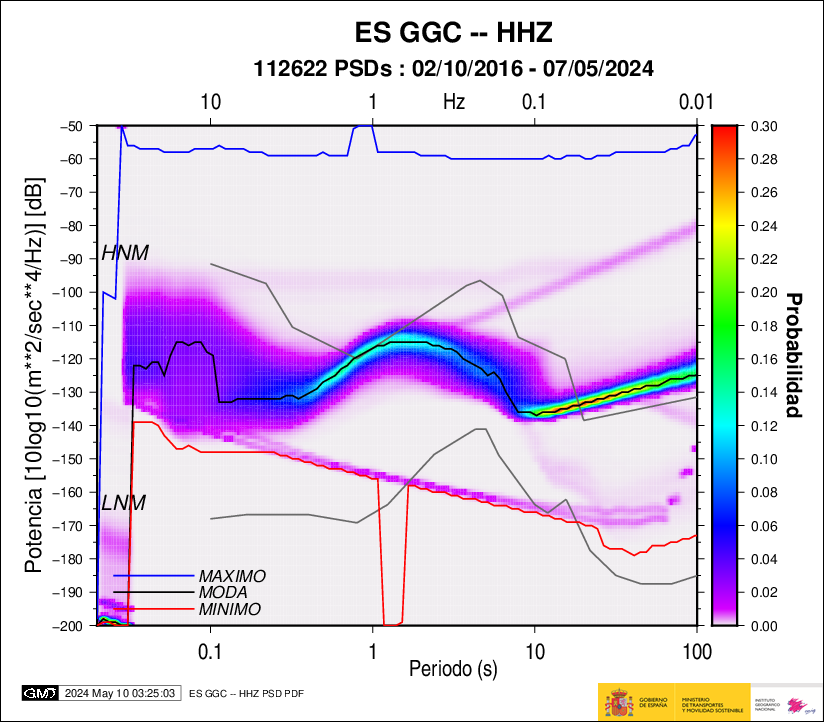
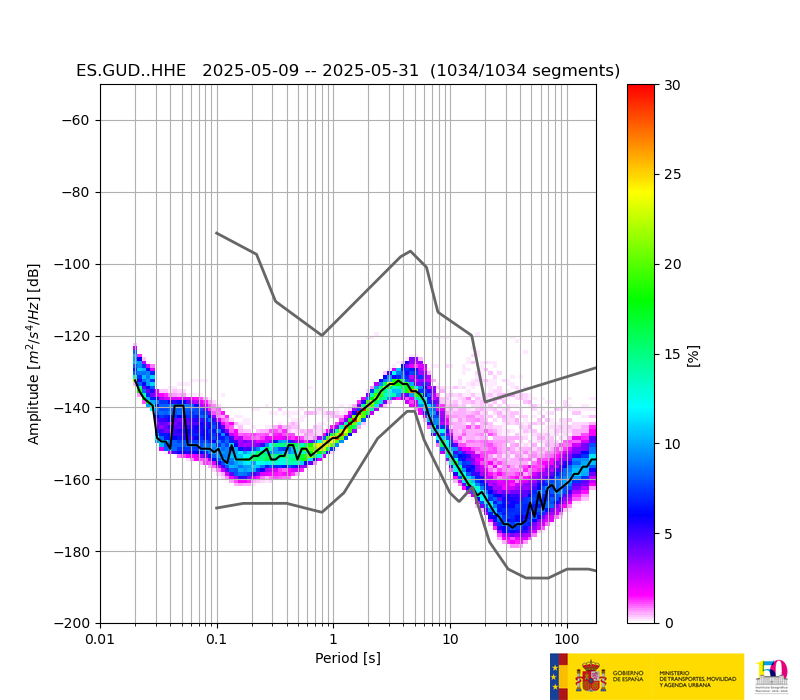
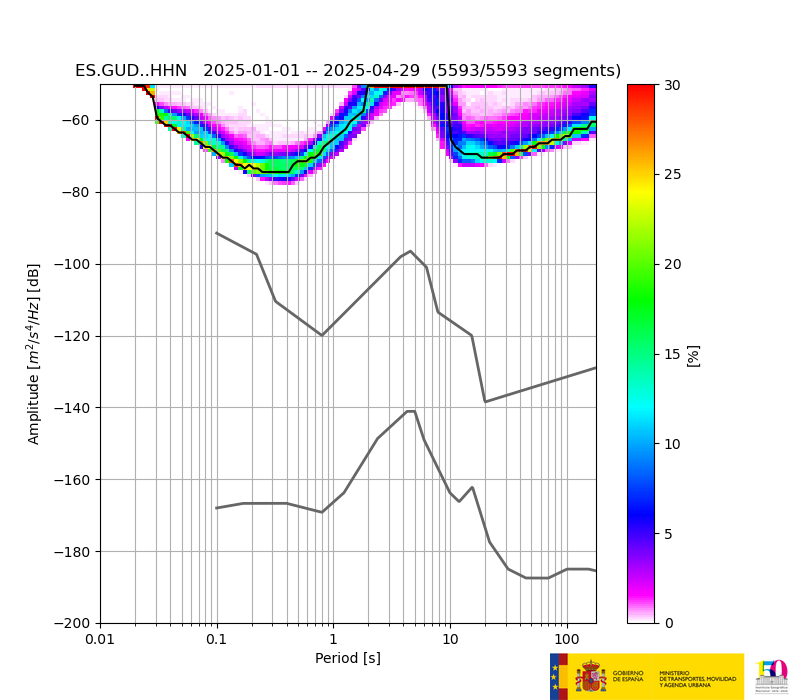
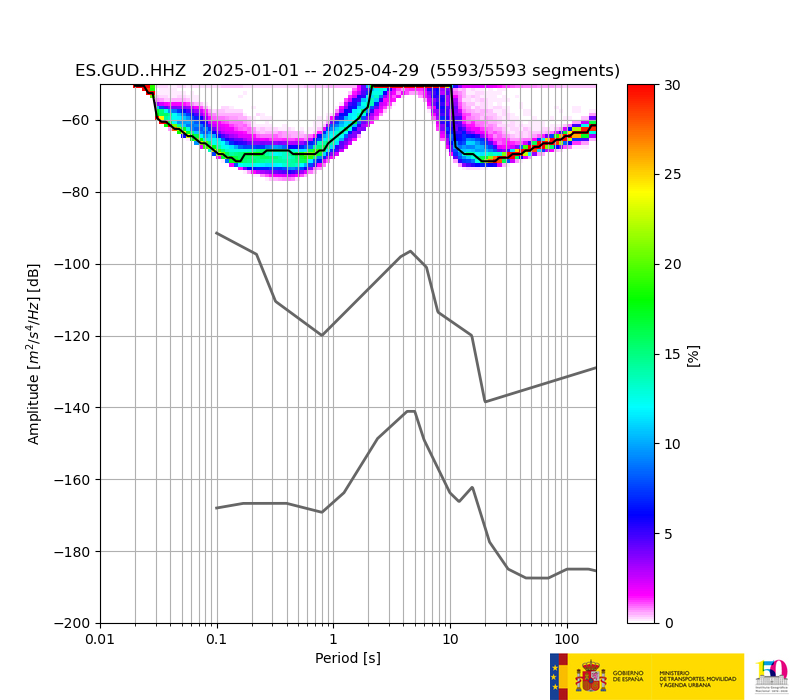
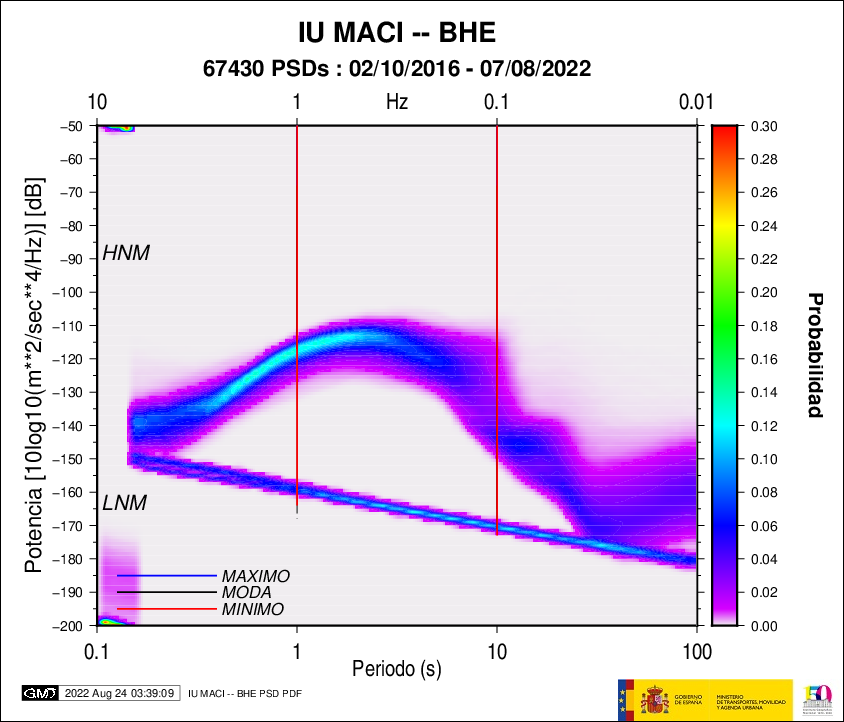
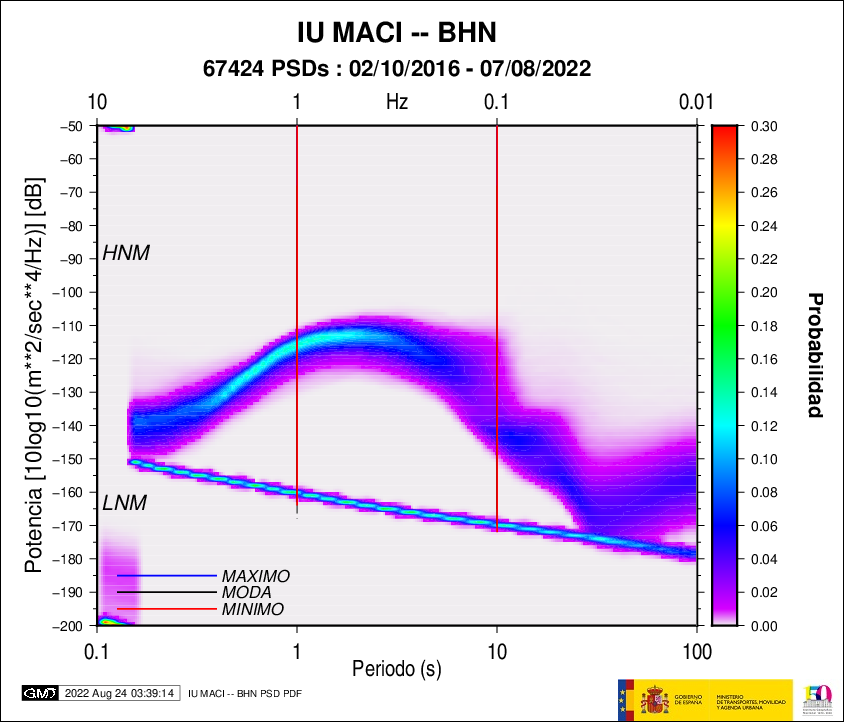
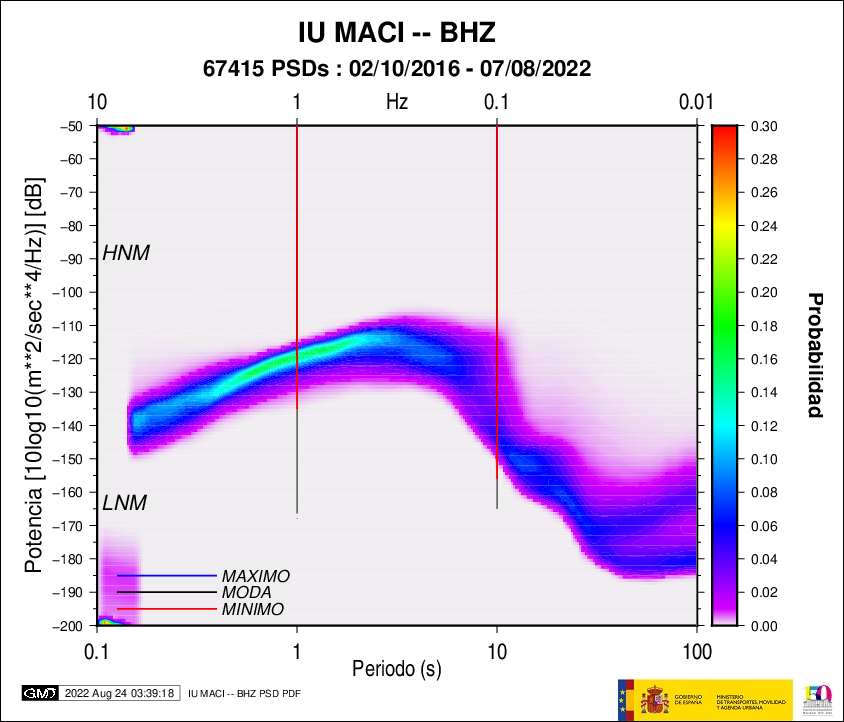
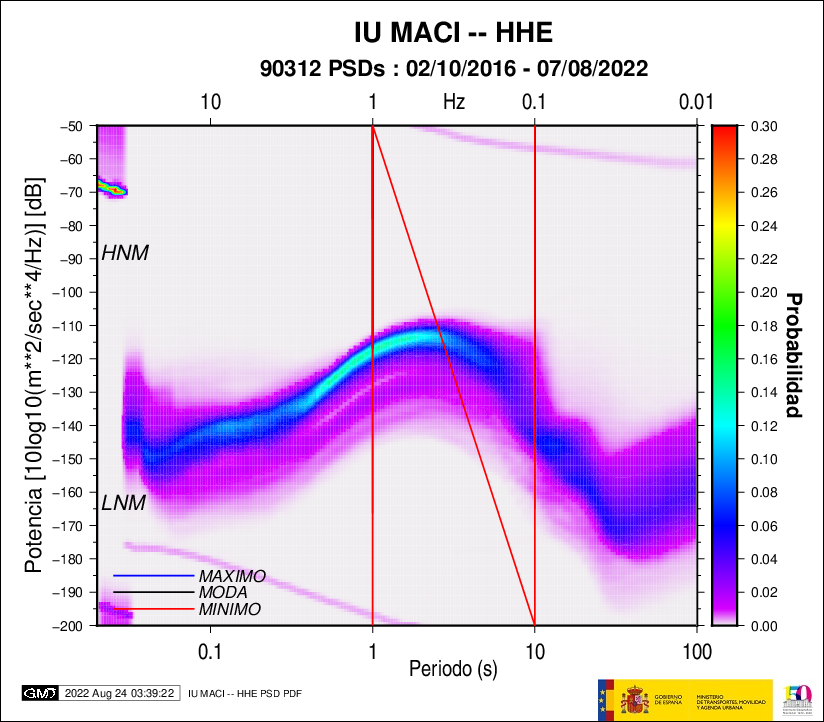
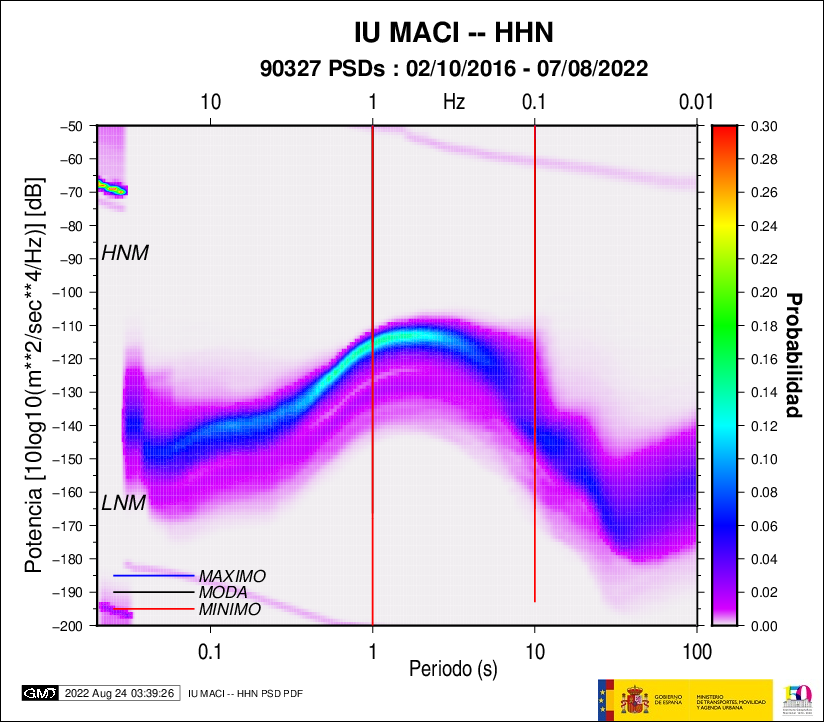
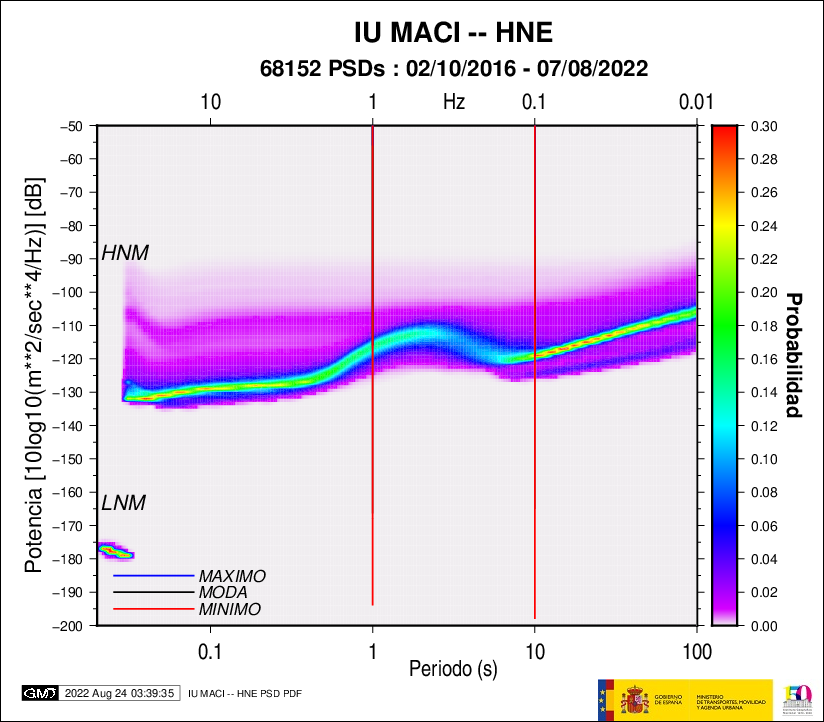
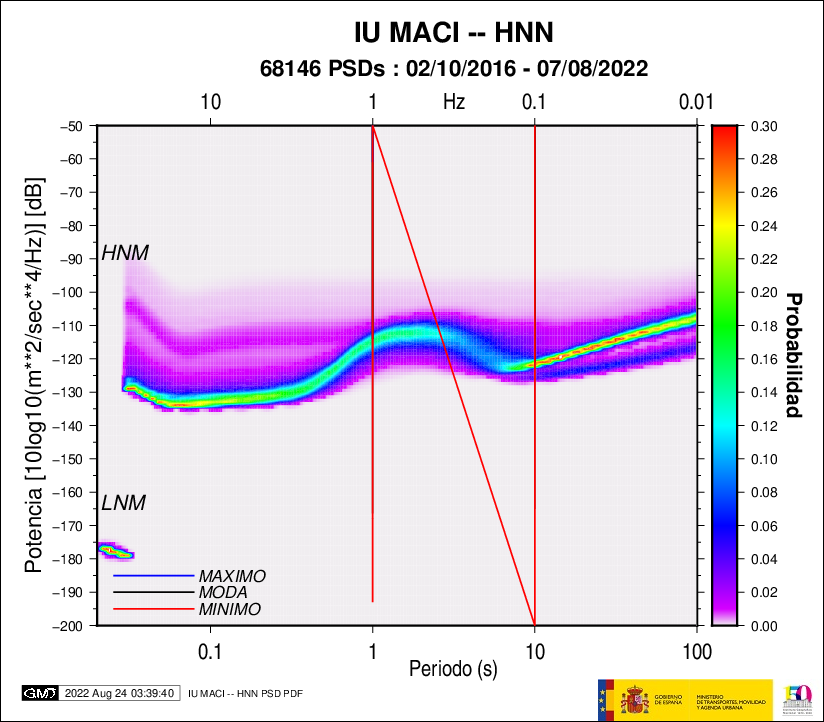
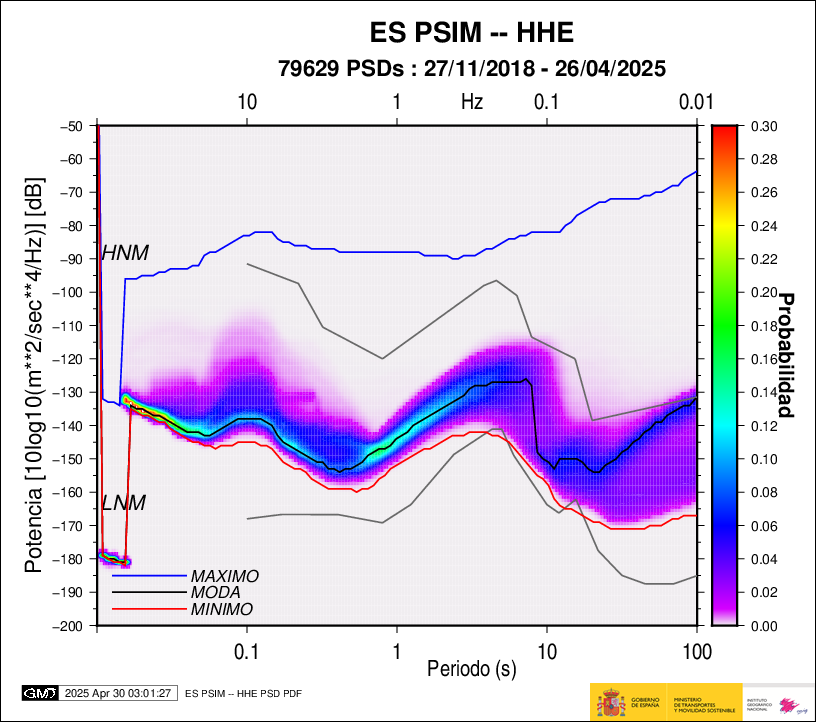
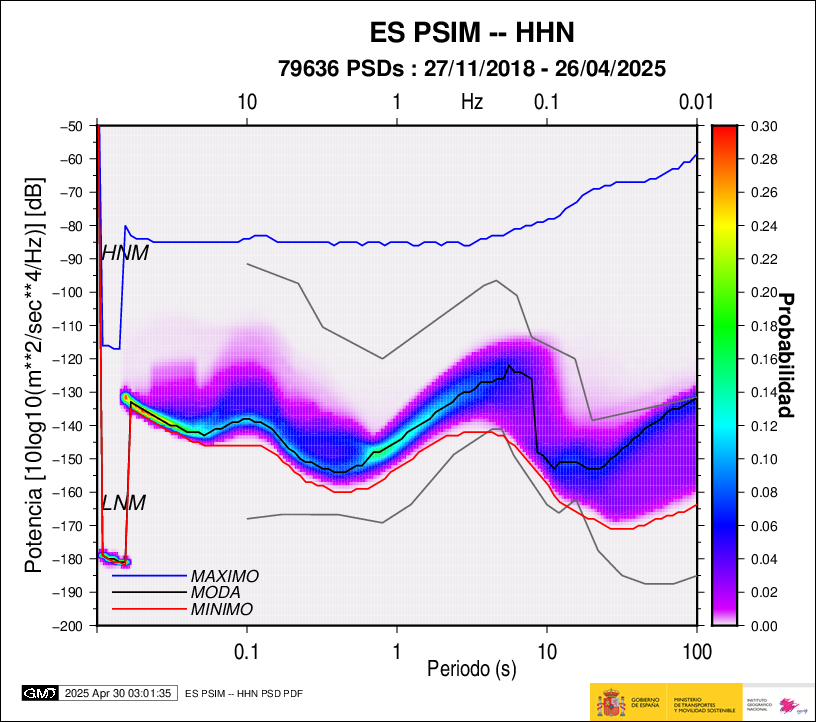
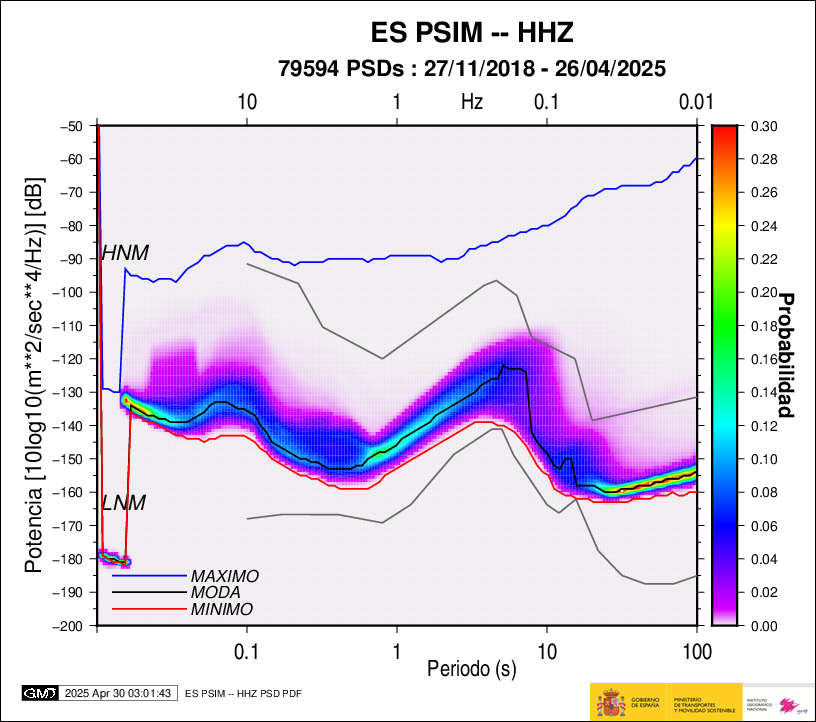
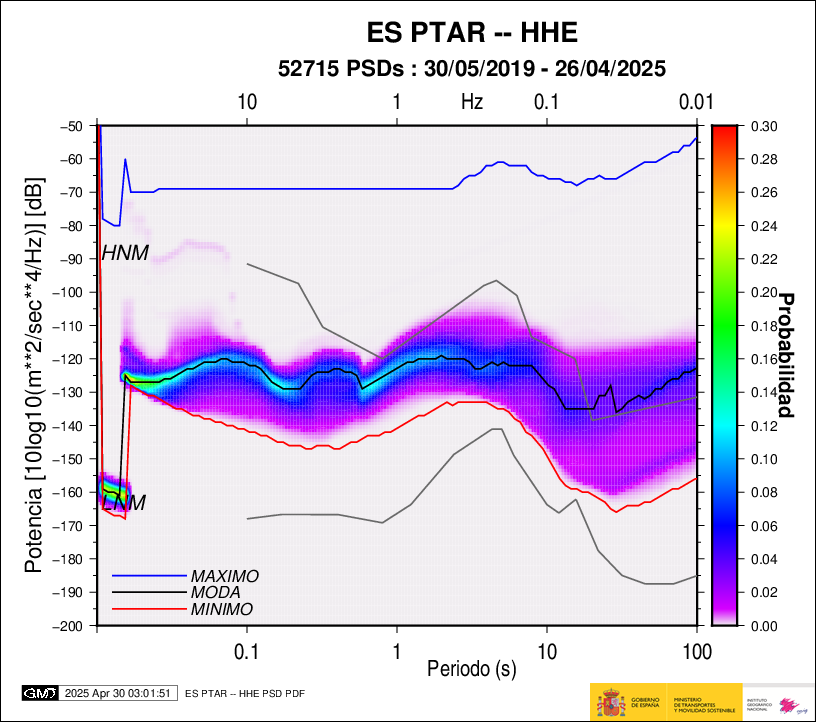
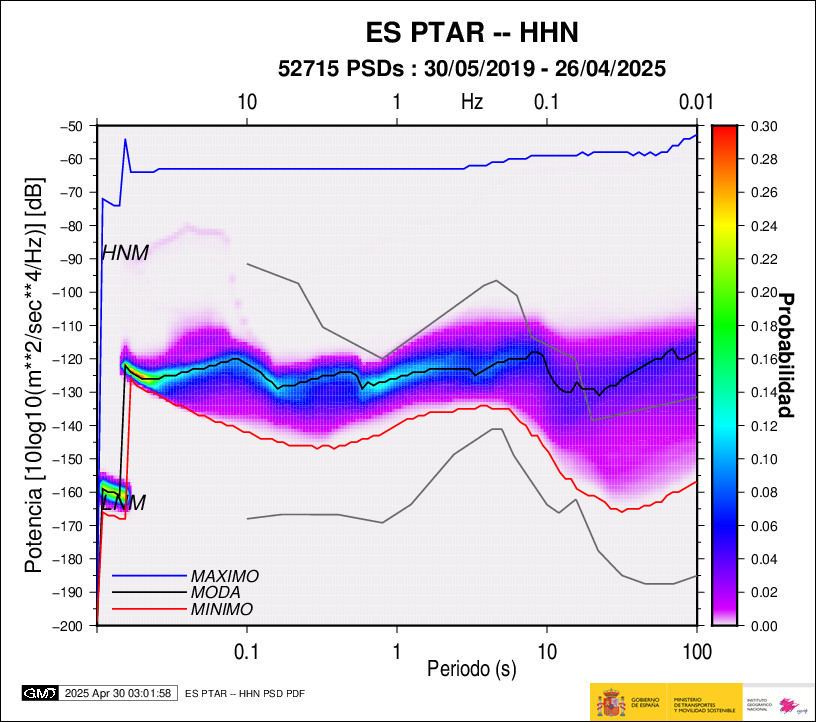
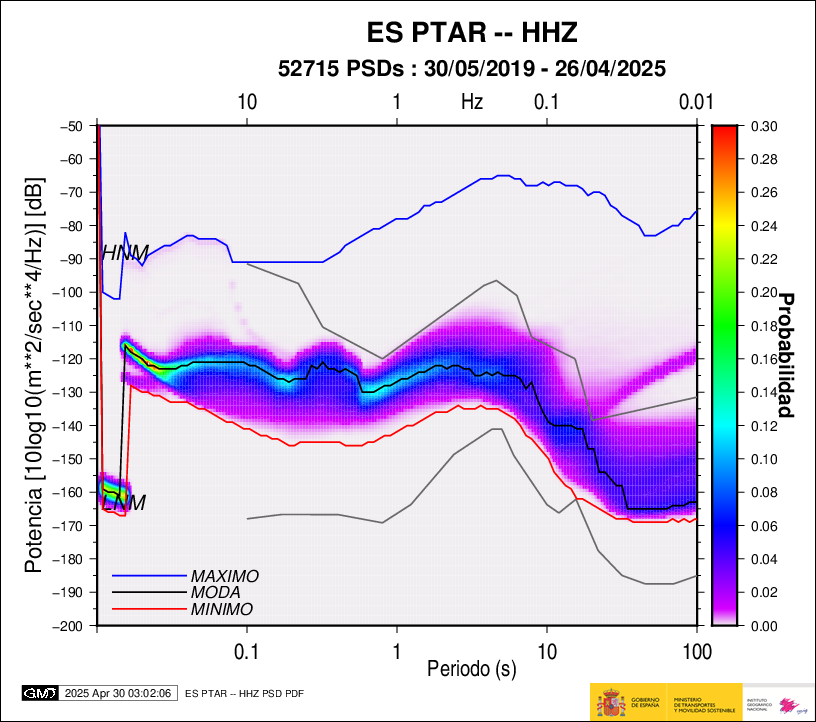
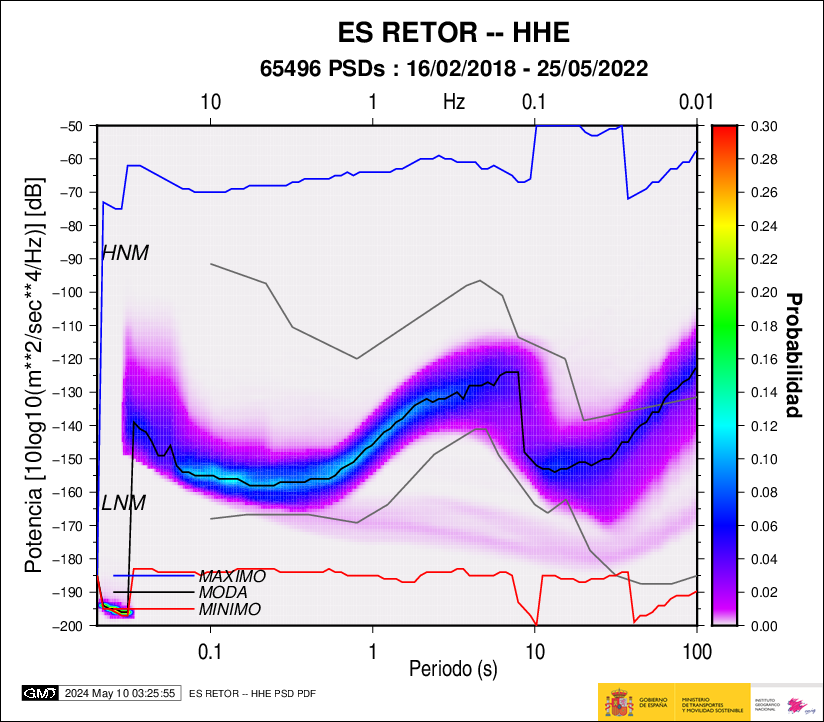
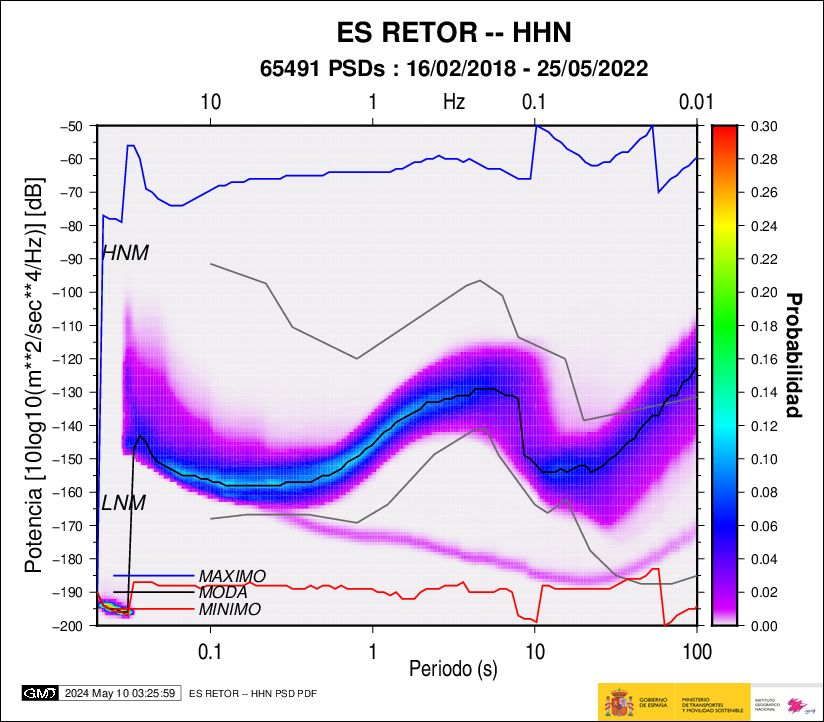
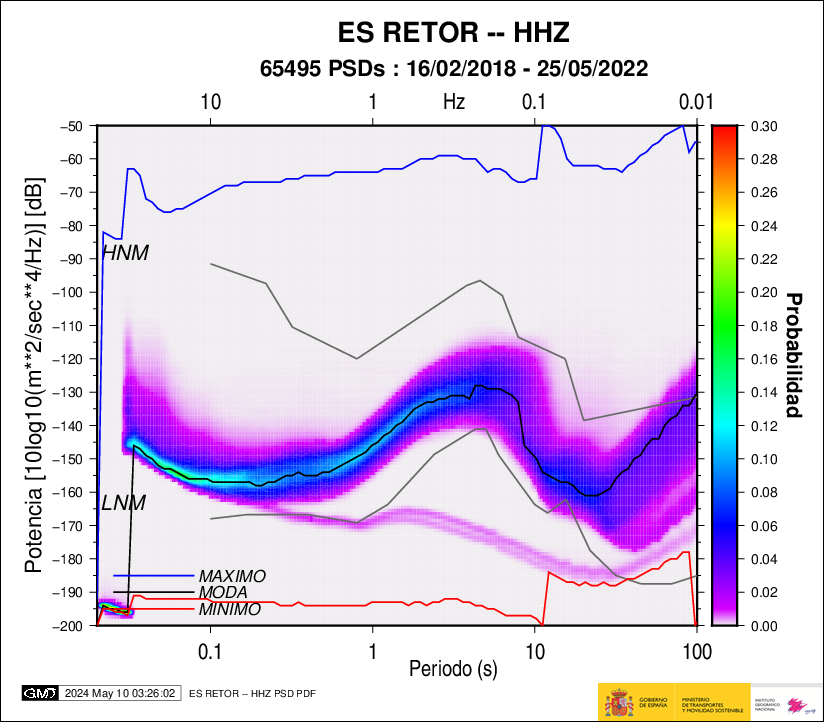
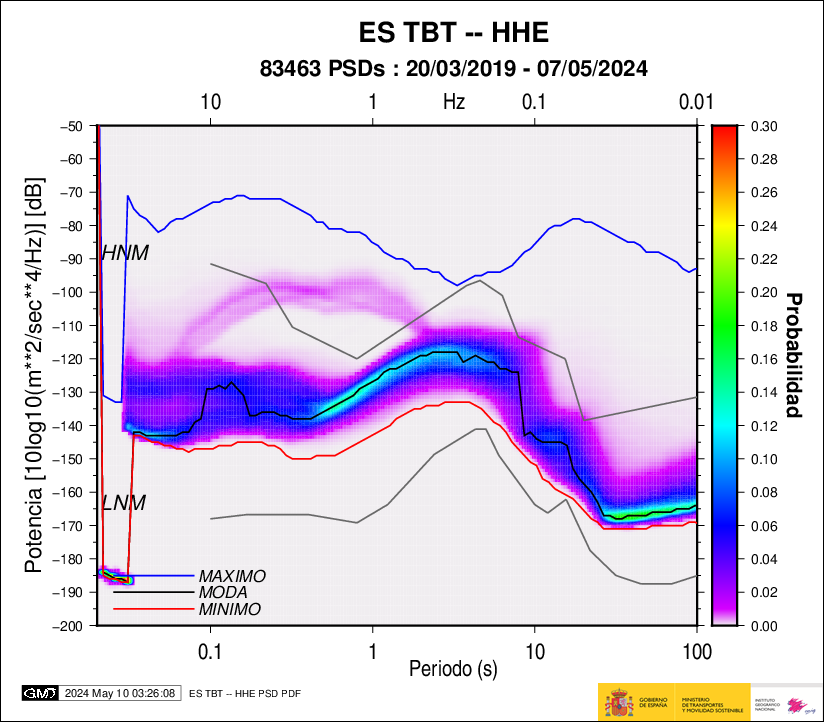
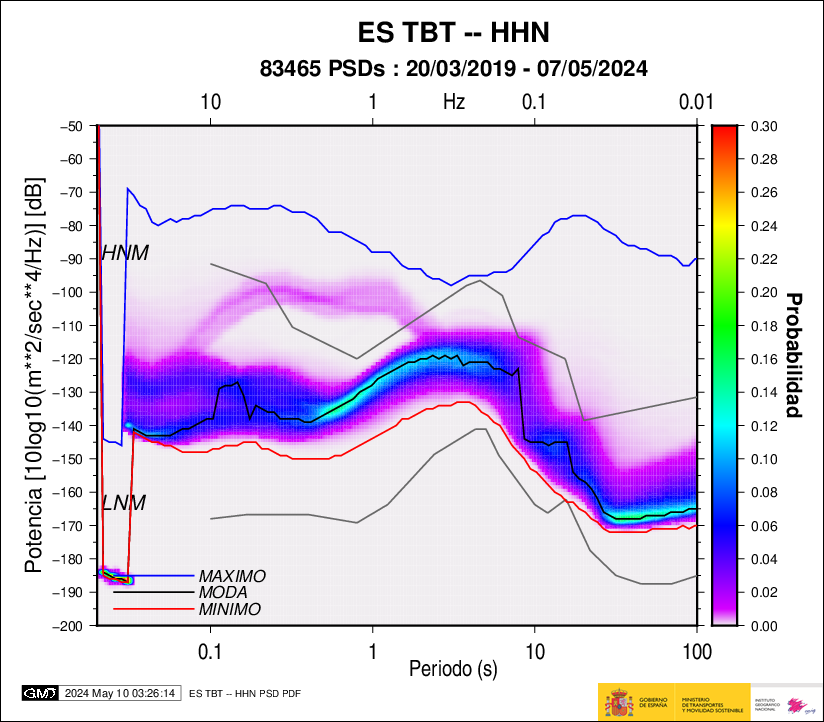
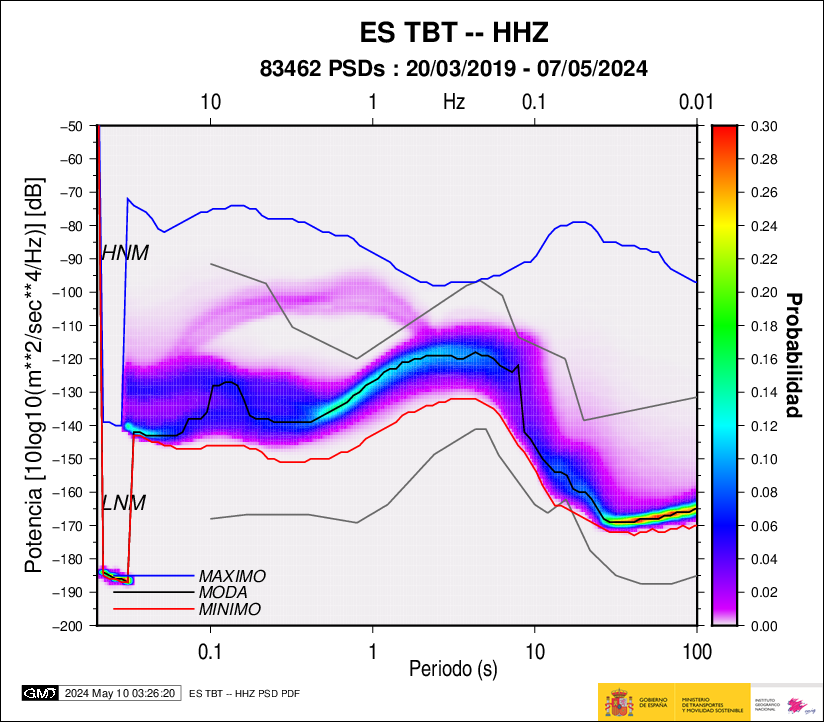
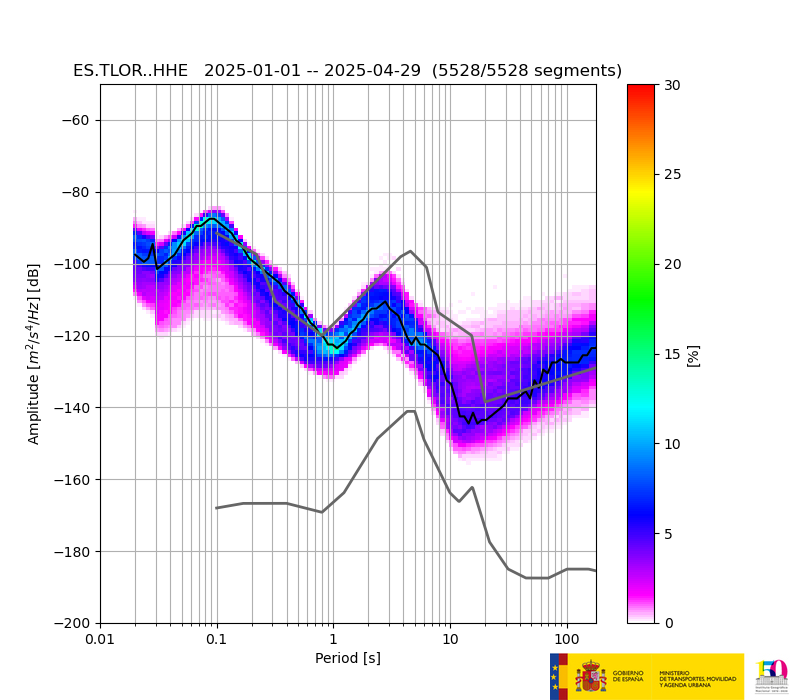
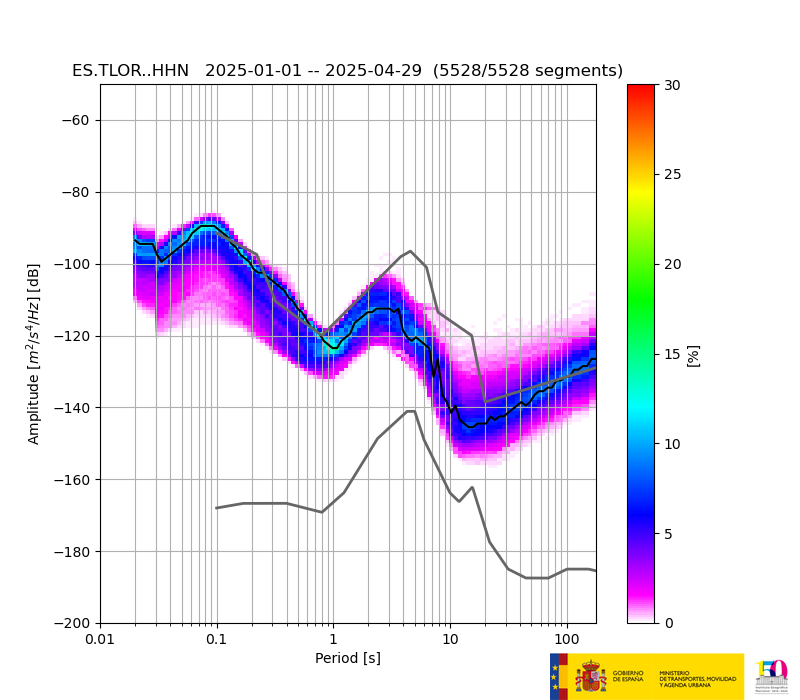
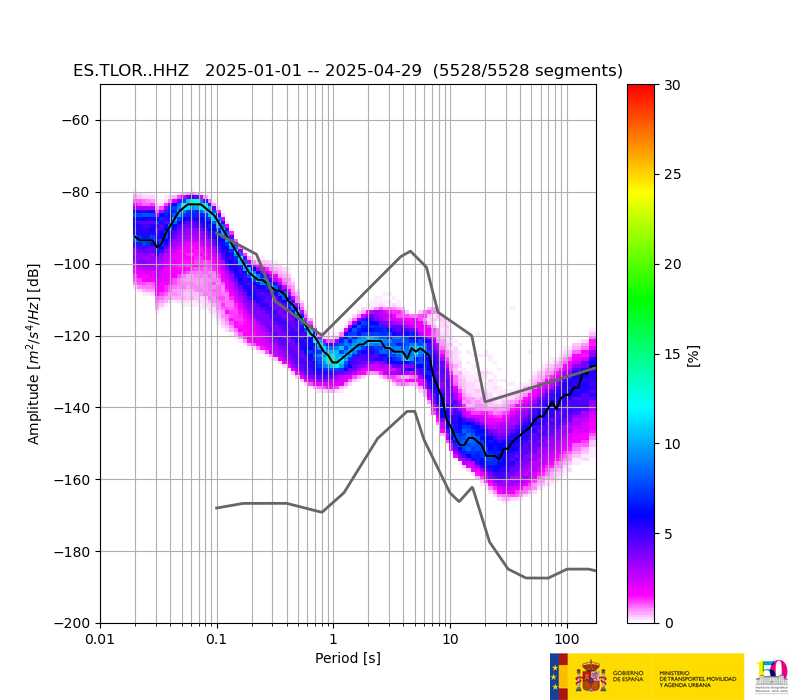
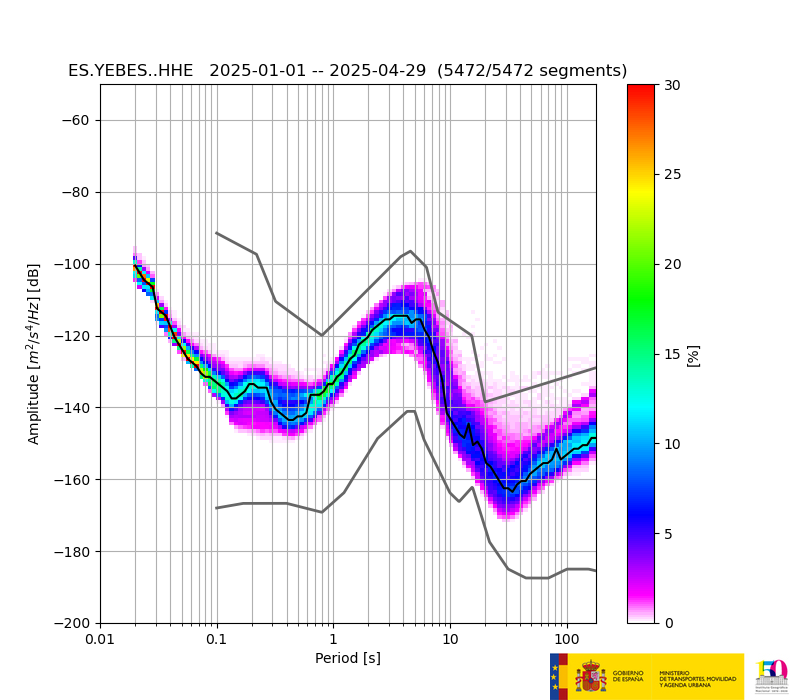
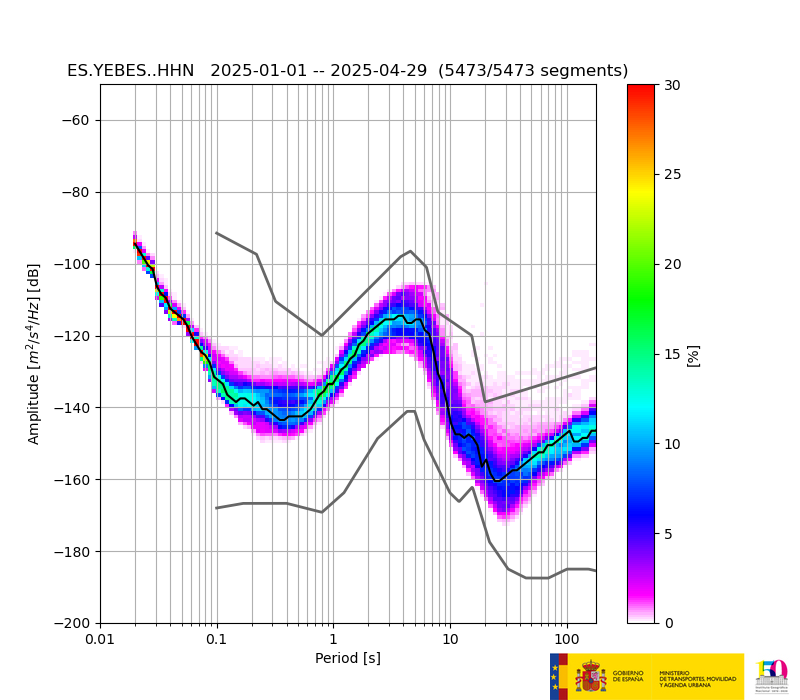
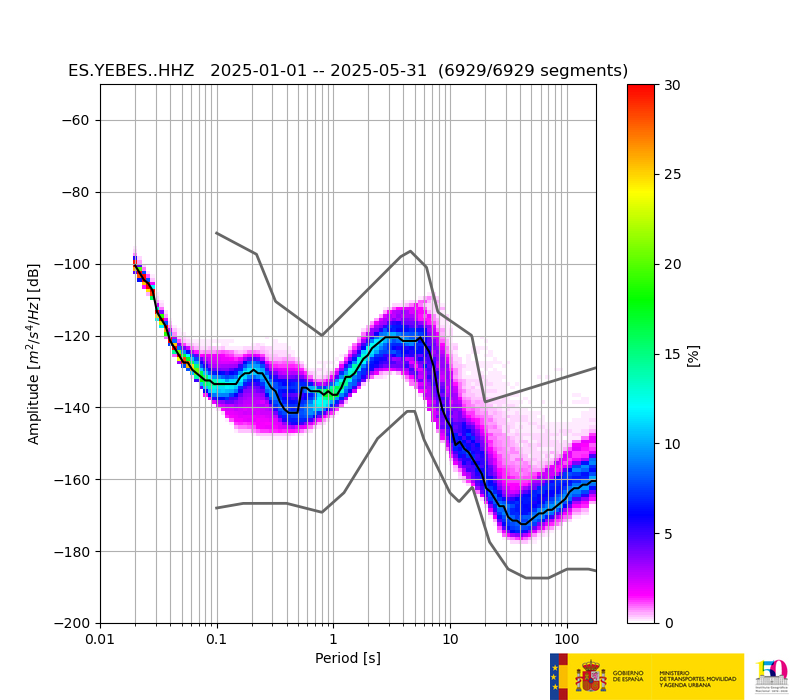
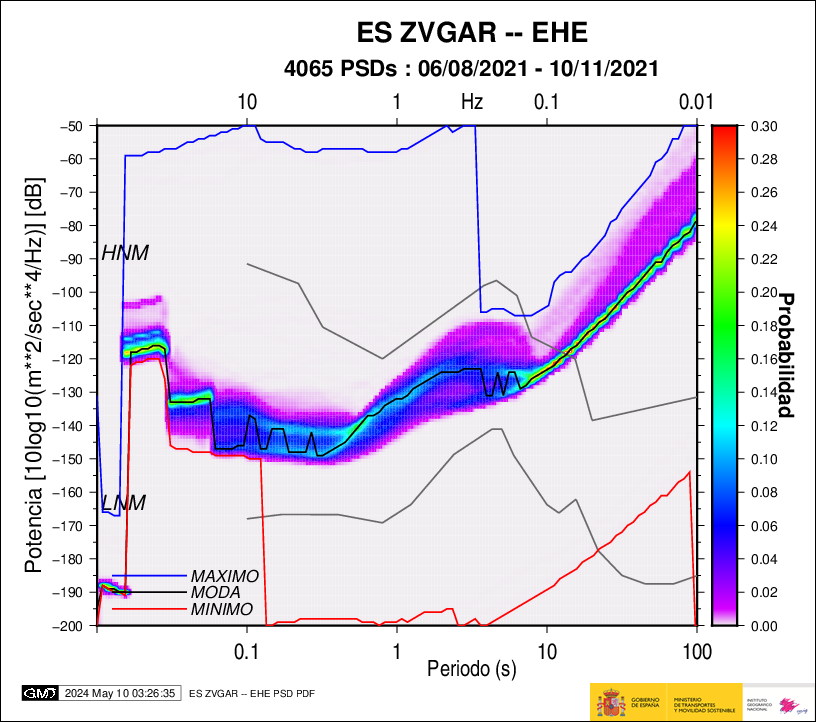
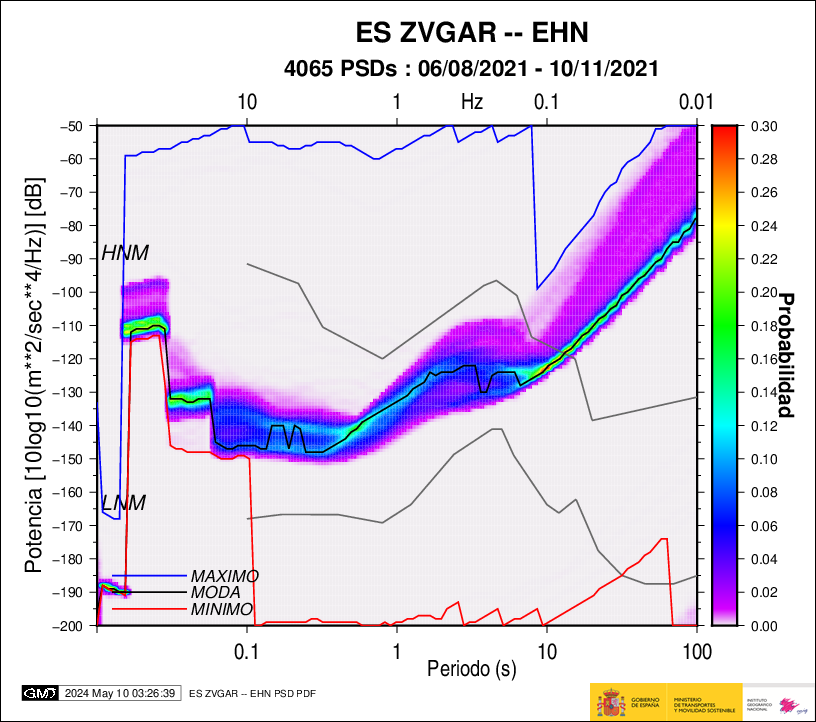
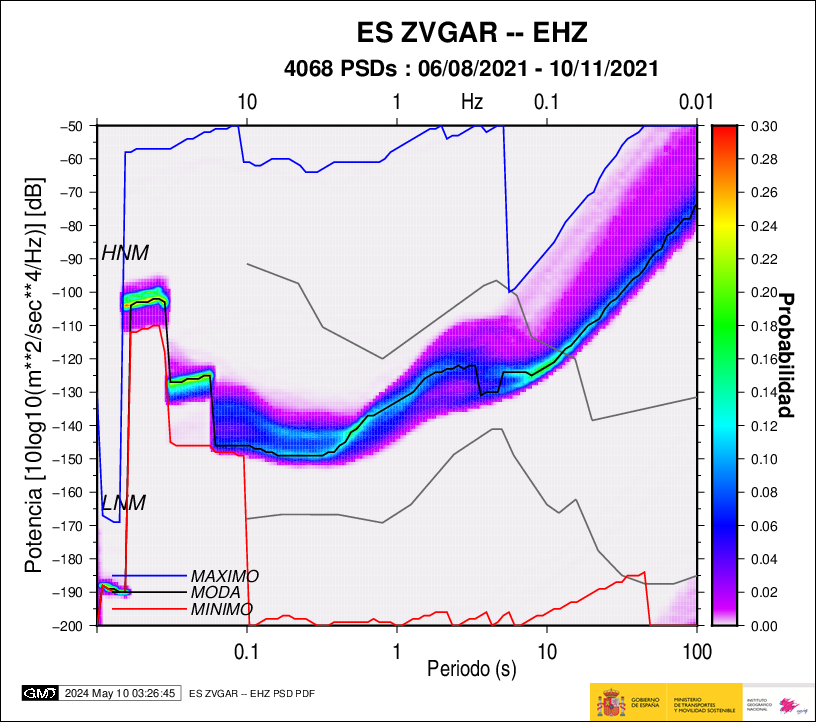
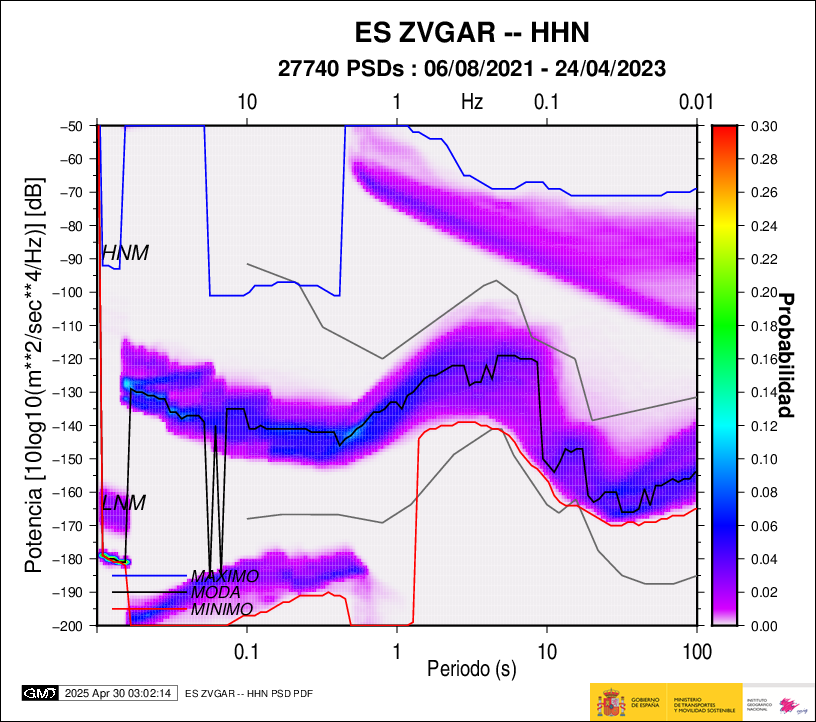
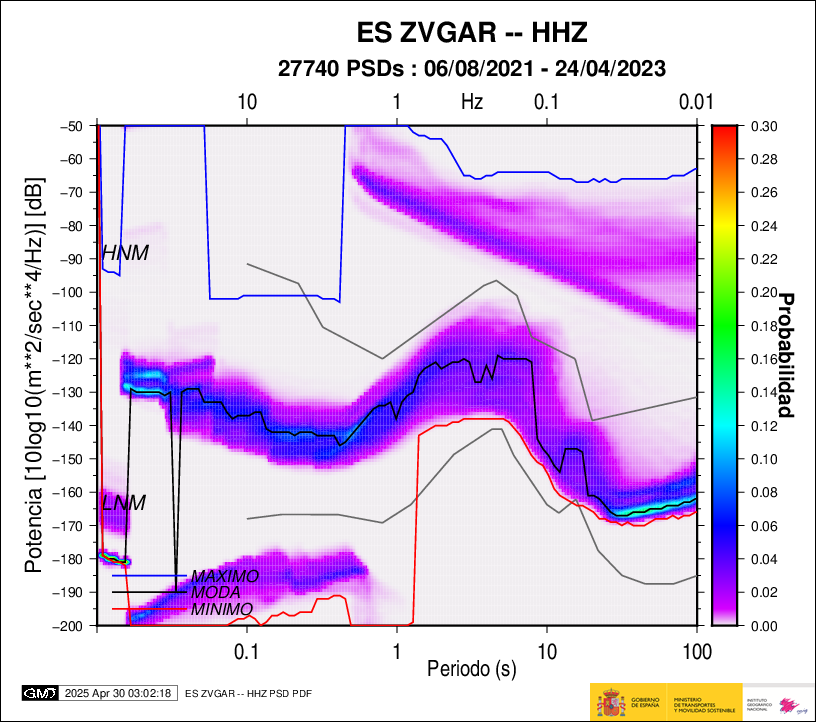
A tool to evaluate the quality of the signals received from each of the seismic stations is the spectral analysis of the ambient noise. This can be done by calculating the spectral power and its probability density function of the recorded continuous seismic data, (Ambient Noise Probability Density Functions).
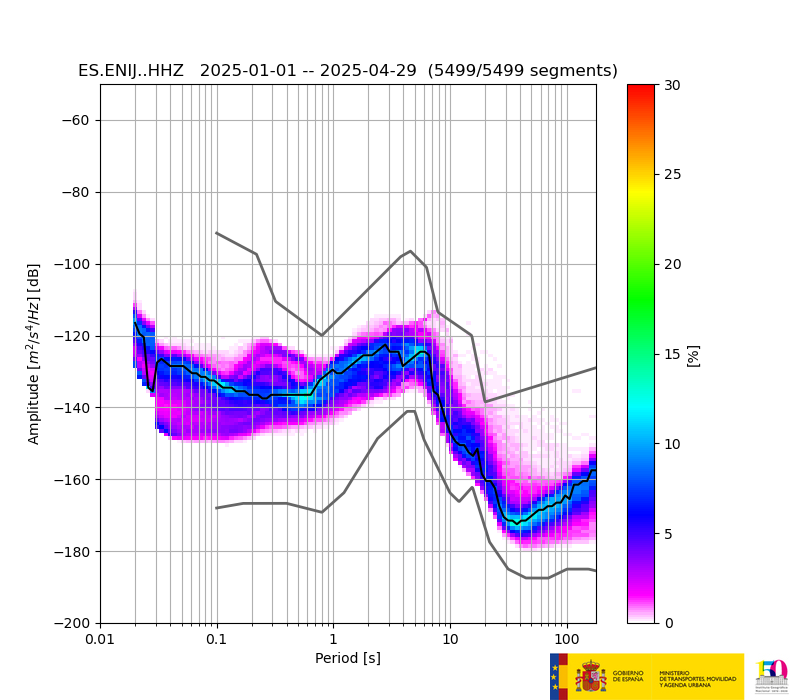
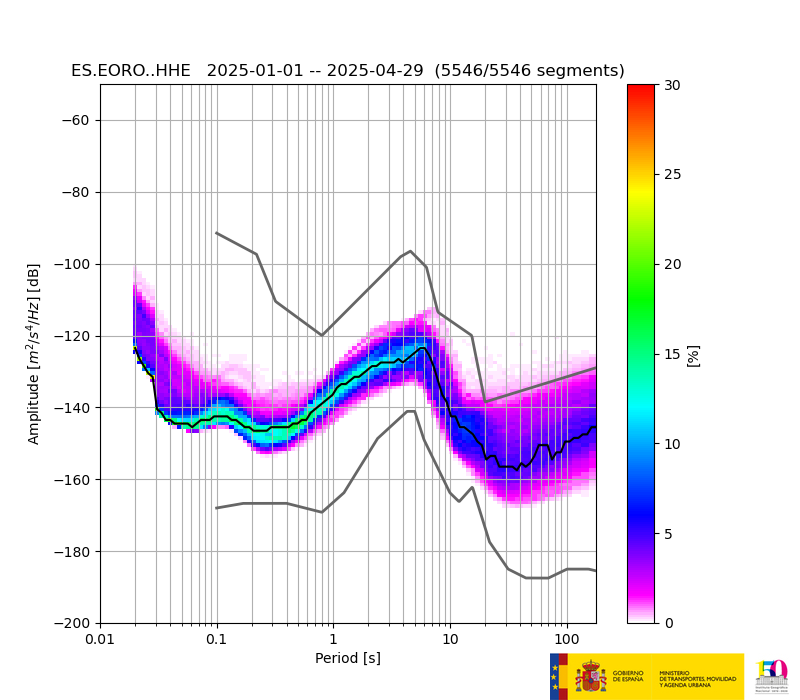
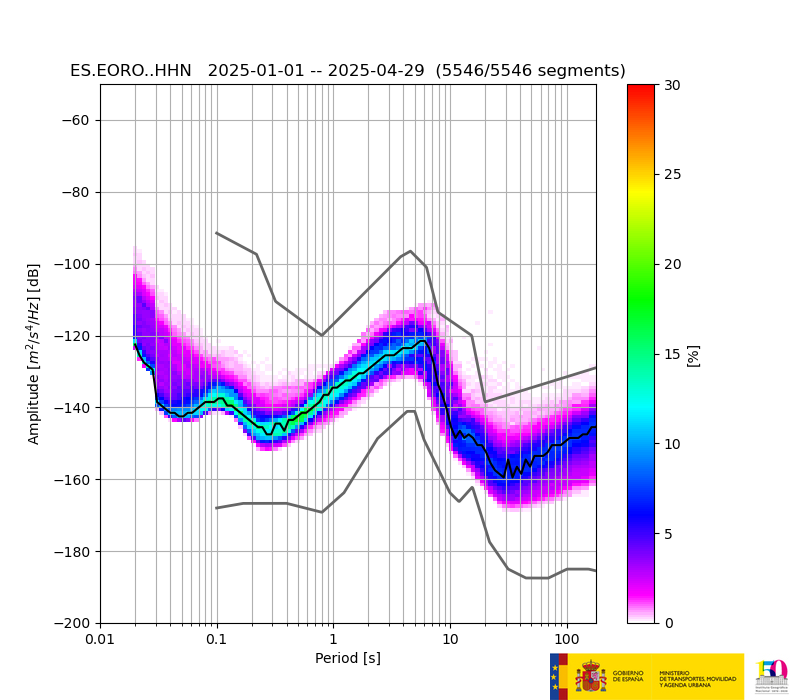
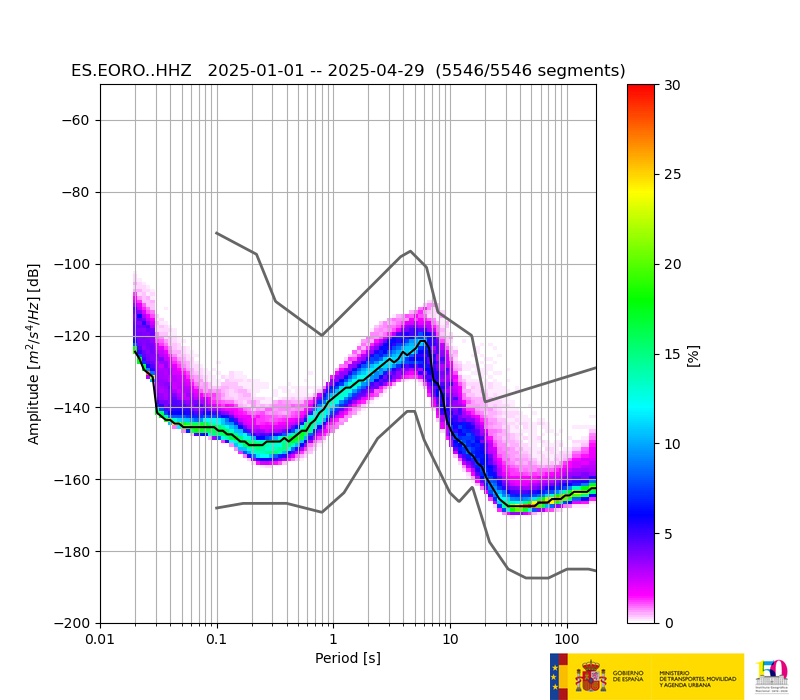
This analysis is presented, carried out according to the technique of Mcnamara and Buland (2004), in which seismic noise records are analyzed continuously and automatically, in half-hour temporary windows, for each of the channels of the seismic stations of the National Geographic Institute. In each of the graphs, the maximum (HNM) and minimum (LNM) admissible noise curves defined by Peterson (1993) have been superimposed.
Results are automatically updated, cumulatively, once a day.
References:
- McNamara, D.E. y R.P. Buland (2004). Ambient Noise Levels in the Continental United States, Bull. Seism. Soc. Am., 94, 1517-1527.
- Peterson, J. (1993). Observation and modeling of seismic background noise, U.S. Geol. Surv. Tech. Rept., 93-322, 1-95.
| Station | Noise graph |
|---|---|
| BASE | |
| C70 | |
| CADE | |
| CALD | |
| CARI | |
| CAVE | |
| CBLA | |
| CBOL | |
| CBRE | |
| CCAL | |
| CCAN | |
| CCHO | |
| CCUM | |
| CDIE | |
| CDLV | |
| CDOS | |
| CENR | |
| CFOR | |
| CFTV | |
| CFUE | |
| CGAR | |
| CGIN | |
| CGOR | |
| CGRA | |
| CGUI | |
| CHI | |
| CINF | |
| CJED | |
| CJUL | |
| CLAJ | |
| CLGU | |
| CLUM | |
| CMCL | |
| CMIR | |
| CNAO | |
| CNOR | |
| CPIT | |
| CPUN | |
| CPVI | |
| CRAJ | |
| CREA | |
| CROM | |
| CTAB | |
| CTAC | |
| CTAN | |
| CTEN | |
| CTFS | |
| CTIG | |
| CTIM | |
| CVIL | |
| E0802 | |
| EADA | |
| EAGO | |
| EALB | |
| EALK | |
| EARI | |
| EBAD | |
| EBAJ | |
| EBEN2 | |
| EBER | |
| EBUR | |
| ECAB | |
| ECAL | |
| ECAZ | |
| ECEL | |
| ECHE | |
| ECHI | |
| EFAM | |
| EGOM | |
| EGOR | |
| EGRO | |
| EHIG | |
| EIBI | |
| EJON | |
| ELAN | |
| ELGU | |
| ELOB | |
| EMAZ | |
| EMIJ | |
| EMIN | |
| EMIR | |
| EMLI | |
| EMOS | |
| EMUR | |
| ENIJ | |
| EORO | |
| EOSO | |
| EPLA | |
| EPOB | |
| EPON | |
| EQES | |
| EQTA | |
| ERTA | |
| ESAC | |
| ESPR | |
| ETOB | |
| ETOS | |
| ETRV | |
| EZAM | |
| FUM | |
| GGC | |
| GUD | |
| IELO | |
| IEPA | |
| IUNC | |
| IZUN | |
| LIV | |
| MACI | |
| MECO | |
| OBS | |
| PSIM | |
| PTAR | |
| RETOR | |
| RON | |
| TBT | |
| TLOR | |
| YARA | |
| YASP | |
| YBER | |
| YEBES | |
| YMUS | |
| YNAR | |
| YSIG | |
| YSOS | |
| YUND | |
| ZVGAR |