Create graphs |
  
|
Create graphs |
|
|
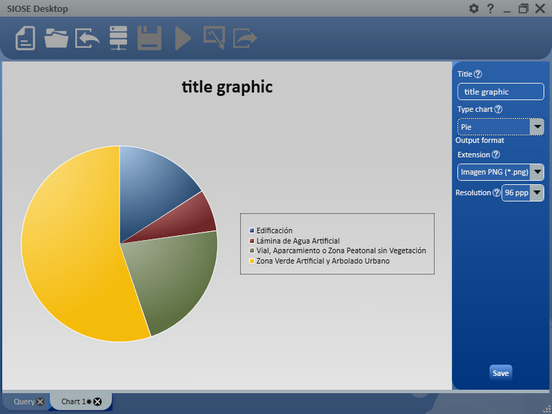
Figure 64. Create graphs key |
This tool makes a sum of surface by type of cover, and allows you to make graphs: bar, column or pie. Subsequently, it saves the image in jpeg, png, bmp or tiff format.
|
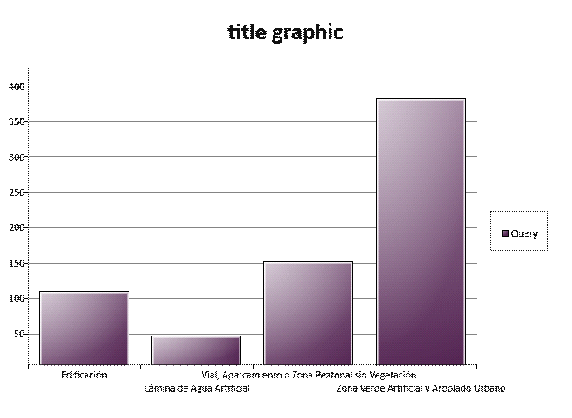
Figure 65. Graph example |
When you select a type of graphic, it creates a graph, with a set of randomized colors. If you select more than one time, you can change the color range.
In the title section, you can choose the title for the graph.
In the type of graph, you choose the type of graphic that you want:
•Pie chart
•Bars
•Columns
In Output forma you can select the output format and its resolution. Types of output formats:
•Bit map (*.bmp)
•JPEG (*.jpg)
•PNG (*.png)
•TIFF (*. Tiff)
The available resolutions are the following:
•72 ppp
•96 ppp (by default, sufficient quality to visualized in the screen)
•150 ppp
•300 ppp (to print)
Save key asks the way and the name where save the selected image with its format.
|
Figure 66. Example of exported image |